A few days ago I attended the Node-RED 101 workshop with Ross Cruickshank - brilliantly organised by the Linuxing in London group. It was an excellent event. One thing that I thought I’d like to highlight for people coming from other data processing tools is the terminology and interface, which is covered below:
Installation
Prerequisits: You have got the LTE version of NodeJS installed on your workstation. You can dowload it from here. For Node-RED to work reliably, the LTE version is required (not the latest version).
For check the version of NodeJS that is installed and once you have confirmed that it is the LTE version proceed with installing Node-RED:
node -v
sudo npm install -g --unsafe-perm node-red
For alternative install methods see here.
To start Node-RED run;
node-red
The Node-RED User Interface is available on:
localhost:1880
All command line options for the node-red command:
Usage: node-red [-v] [-?] [--settings settings.js] [--userDir DIR] [flows.json]

Options:
  -s, --settings FILE  use specified settings file
  -u, --userDir  DIR   use specified user directory
  -v                   enable verbose output
  -?, --help           show usage
Basics
Terminology
| Term | Description |
|---|---|
| Flow | Graphical representation of processing instructions |
| Node | Graphical representation of a processing function. A flow consists of many nodes. Every node accepts msg.payload. |
| Node port | Data input or output point of node. Represented by a small grey square on the left and/or right hand side of the node. |
| Wire | Connections between nodes that depict the flow of data. |
Interface

From the left to the right:
- Palette: Shows available Nodes, which are conveniently grouped (input, output, function, social storage, analysis, advanced)
- Workspace: By dragging nodes from the palette onto the workspace and connecting them you can create a flow.
- Sidebar: Displays info on the nodes and the debug log.
Running and Stopping Flows
Once you click Deploy, the flow gets published to the server and is running (button color changes to grey once flow is published successfully). If you make changes to the flow, the Deploy button changes its color to red again and you have to click Deploy again to make sure the latest version is available on the server.
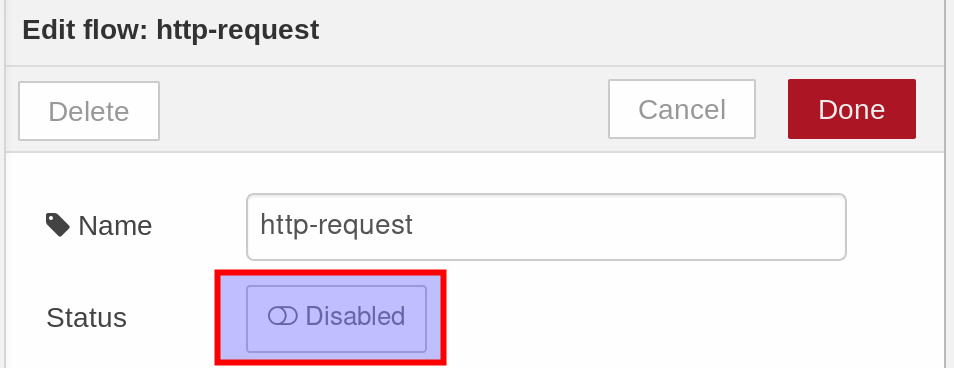
You might have realised that there is no Stop button available via the main interface. There is, however, a similar concept of disabling a flow. To do this, double click on the flow title. The Edit flow dialog will come up which allows you to change the Status of the flow to Disabled:
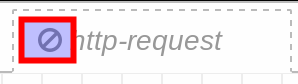
Once you click Done, the title tab also shows a disabled icon:
Useful Keyboard Shortcuts
| Shortcut | Description |
|---|---|
CTRL+space |
Toggle sidebar |
CTRL+f |
Search |
CTRL+g+i |
Show info panel |
CTLR+g+d |
Show debug panel |
Where are my flows, setting etc stored?
By default they are stored under ~/.node-red.
You can find flows in:
.node-red/flows_localhost.localdomain.json
Selectively importing and exporting flows
Via the Humburger icon on the top right corner you can reach the Import and Export options. The Export option will be only enabled once you mark a few nodes for selection on the workspace.

Exercises
Hello World
Double click the title tab. This will bring up the Edit flow dialog. Set the Name to Hello World and then click Done.
Flows normally expect an input data source, however, for testing purposes you can use the inject node to manually inject messages into the flow (by clicking on the handle on the left hand side of the node) or set a time to inject messages.
Click on the inject node and notice how the info panel on the right hand side shows related help text.
Double click on the inject node to bring up the node properties:
- Payload: Click on the same button with a down arrow and pick String from the list.
- Topic: Type
Hello World!.

At the bottom of the same screen there is also a node settings section - we won’t change anything here now, but keep it in mind for later on. Click Done.
Add a Debug node and connect the two by clicking on the output node port of the inject node and dragging the cursor to the input node port of the debug node.
Click Deploy in the top right corner. Then click the right handle of the inject node and click on the debug panel to see the output of the stream:

Your first REST API
Our next exercise is slightly more complex, but a bit more exciting:
Add a http node to the workspace (You can either use a new sheet to create the flow or use the existing one). The http node acts as a receiver in Express that gets the request.
Double click on the node and configure it as follows:
- Method:
GET - URL:
/hello. This should be exposed via:
http://127.0.0.1:1880/hello
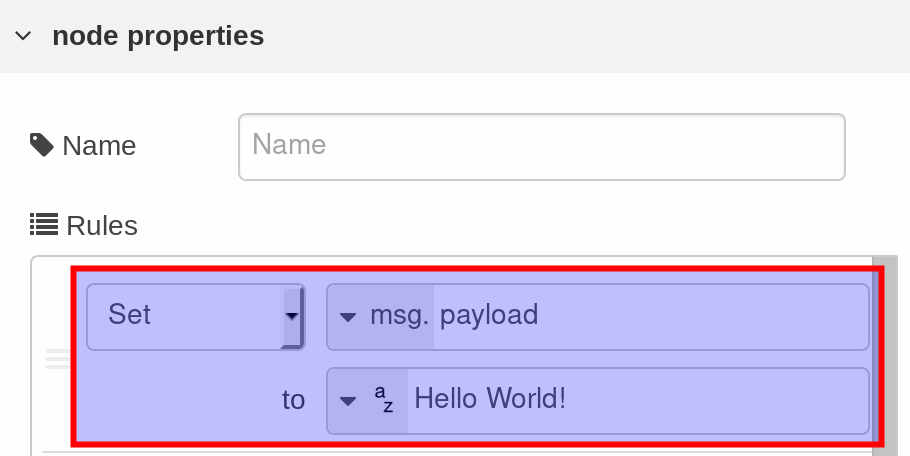
Since we also want to return a message once someone triggers a request, we have to create a payload message. This can be achieved by adding a change node to the workspace. Connect the two nodes. Double click on it and configure it as follows:
- Set
msg.payload - to: From the pull down menu pick String and set the value to
Hello World!.
So now that we have a message, we want to add some formatting. Add a template node to the workspace and connect it. Configure it as follows:
- Name: add css
- Set property:
msg.css - Template content:
body {
    font-family: Arial, Helvetica, sans-serif;
}
#hello {
    color: cadetblue;
    font-weight: bold;
    font-size: 2em;
}

Click Done.
Next we want to create the HTML snippet that returns our message. Add yet another template node and connect it. This node has full support for the [Moustache](https://en.wikipedia.org/wiki/Mustache_(template_system) templating system. Configure it as follows:
- Name: add html
- Set property:
msg.payload - Template content:
<style> {{{css}}} </style>
<h1>My response:</h1>
<div id="hello">{{payload}}</div>

As you can see we can use all the HTML magic here and the CSS and Payload get inserted at the required places thanks to Mustache. Note that having three curly brackets avoids having things replaced (Mustache being clever). Click on Done.
Finally we add a http request. In our case there is nothing to configure. Your flow should look like this now:
 Note that I didn’t explain above how to add the debug node - this is not really required, but you can add one yourself as well if you want to.
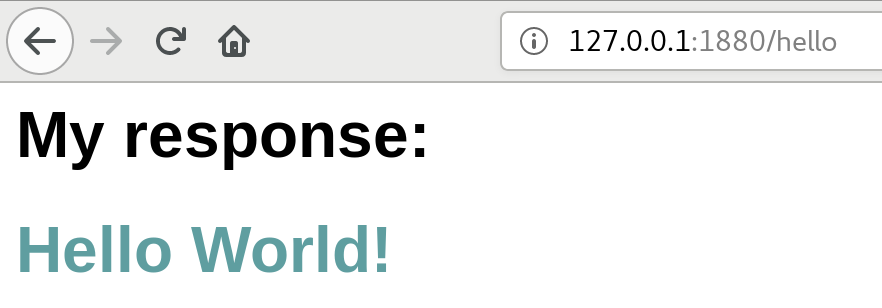
Now click Deploy, open a new browser tab and enter following URL
http://127.0.0.1:1880/hello
The result should look like this: