Introduction
As many of you will know, Hadoop historically did not support updates. Recently, however, support for updates was added to Hive about a year ago, but don’t expect balzing fast performance from it.
If you are using Pentaho Data Integration on Hadoop, chances are that you want to store the execution logs somewhere. The problem is though that the out-of-the-box execution logging only supports relational databases (as it requires updates). You could also store the standard text logs directly on Hadoop, but let’s come up with a nicer solution: I quite like the idea of storing all the data in one place, so I do not want to opt for a relational database but keep everything on Hadoop. And these days we have a few fast query engines available on Hadoop as well, so there shouldn’t be anything stopping us from putting this process in place.
The Setup
The Data Layer
The strategy is very simple: We just want to store the following basic info (and can possibliy extend on this later on):
| field name | description |
|---|---|
di_process_id |
As there is currently no built-in support for auto-incremented ids in Hive nor in Impala, we will just generate a UUID. |
di_process_name |
The name of the job or transformation that is being executed |
di_process_status |
Will be set to running, error or finished. |
creation_time |
The time this very record was created. |
You should have a local Hadoop dev environment set up (be it vanilla Apache Hadoop, CDH, HDP, MapR etc). If you don’t have such an environment available or do not want to set one up, you can also use PostgreSQL or similar (any relational DB with foreign data wrapper support) as an alternative just to test this process. For those ones that want to use PostrgreSQL instead, find some special instructions at the very end of this article.
Based on the data points we specified above, the DDL for our table should look like this:
CREATE DATABASE logs;
CREATE TABLE logs.di_process_log
(
  di_process_id STRING
  , di_process_name STRING
  , di_process_status STRING
  , creation_time TIMESTAMP
)
ROW FORMAT DELIMITED FIELDS TERMINATED BY '001'
STORED AS TEXTFILE
;
For each execution of a data integration process, we will store two records in this table. It’s not very nice to read the data this way: Luckily, both Impala, Hive and Presto support windowing functions, so we can condense this data a bit for better readibiliy:
CREATE VIEW logs.vw_di_process_log AS
SELECT
  di_process_id
  , di_process_name
  , current_status AS di_process_status
  , start_time
  , end_time
  , COALESCE(
      ( UNIX_TIMESTAMP(end_time) - UNIX_TIMESTAMP(start_time) ) / 60
      , ( UNIX_TIMESTAMP() - UNIX_TIMESTAMP(start_time) ) / 60
    ) AS duration_minutes
FROM
(
  SELECT
    di_process_id
    , di_process_name
    , di_process_status
    , COALESCE(
        LEAD(di_process_status, 1) OVER (PARTITION BY di_process_id ORDER BY creation_time)
        , di_process_status
      ) AS current_status
    , creation_time AS start_time
    , LEAD(creation_time, 1) OVER (PARTITION BY di_process_id ORDER BY creation_time) AS end_time
  FROM logs.di_process_log
) a
WHERE
  /* keep first record only */
  di_process_status = 'running'
ORDER BY start_time DESC
;
Equivalent query for Presto:
CREATE VIEW logs.vw_di_process_log AS
SELECT
  di_process_id
  , di_process_name
  , current_status AS di_process_status
  , start_time
  , end_time
  , COALESCE(
      ( TO_UNIXTIME(end_time) - TO_UNIXTIME(start_time) ) / 60
      , ( TO_UNIXTIME(CURRENT_TIMESTAMP) - TO_UNIXTIME(start_time) ) / 60
    ) AS duration_minutes
FROM
(
  SELECT
    di_process_id
    , di_process_name
    , di_process_status
    , COALESCE(
        LEAD(di_process_status, 1) OVER (PARTITION BY di_process_id ORDER BY creation_time)
        , di_process_status
      ) AS current_status
    , creation_time AS start_time
    , LEAD(creation_time, 1) OVER (PARTITION BY di_process_id ORDER BY creation_time) AS end_time
  FROM logs.di_process_log
) a
WHERE
  /* keep first record only */
  di_process_status = 'running'
ORDER BY start_time DESC
;
This view basically turns our initial records:
| di_process_id | di_process_name | di_process_status | creation_time |
|---|---|---|---|
| fa3a55ac-d341-11e5-8cca-29f865b7b98b | sample job | running | 2016-02-14 17:40:02.913 |
| fa3a55ac-d341-11e5-8cca-29f865b7b98b | sample job | error | 2016-02-14 17:40:02.953 |
.. into a flat representation:
| di_process_id | di_process_name | di_process_status | start_time | end_time | duration_minutes |
|---|---|---|---|---|---|
| fa3a55ac-d341-11e5-8cca-29f865b7b98b | sample job | error | 2016-02-14 17:40:02.913 | 2016-02-14 17:40:02.953 | 00:00:00.04 |
É violá, we have our very basic logging table, which we can extend with additional data in future if we wanted to.
The DI Process Logic
As the whole setup is a bit complex, I will not go into too much detail and only cover the main points. You can download the process from here if you want to get a deeper understanding.
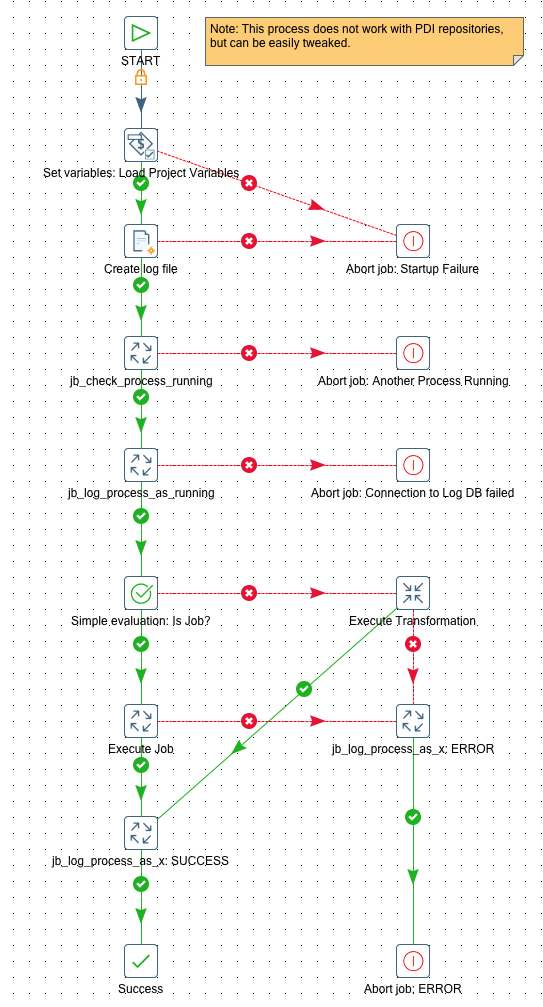
The process for storing this logging data looks like this:
The Wrapper Job
Name: jb_master_wrapper
This job expects following parameters:
| Parameter | Description |
|---|---|
VAR_DI_PROCESS_NAME |
Pretty print name of transformation or job |
VAR_PROPERTIES_FILE |
Full path to and name of properties file |
VAR_DI_PROCESS_FILE_PATH |
Full path to and name of ktr or kjb file you want to execute |
We store these project specific properties in a dedicated properties file:
VAR_DB_LOGGING_NAME=logs
VAR_TABLE_CUSTOM_PDI_LOGS=di_process_log

# Setup for vanilla Apache Hadoop and Presto
VAR_HDFS_HOST=localhost
VAR_HDFS_PORT=8020
VAR_DB_LOGS_JDBC_URL=jdbc:presto://localhost:8080/hive/logs
VAR_DB_LOGS_JDBC_DRIVER=com.facebook.presto.jdbc.PrestoDriver
VAR_DB_LOGS_USER_NAME=a
VAR_DB_LOGS_PW=a
VAR_TABLE_REQUIRES_REFRESH=N
VAR_DI_LOG_FILE_PATH=/user/hive/warehouse/logs.db/di_process_log/di_process_log.txt
VAR_PDI_TEXT_DELIMITER=$[01]
VAR_PDI_TEXT_ENCLOSURE=

# Setup for CDH Quickstart
#VAR_HDFS_HOST=192.168.0.3
#VAR_HDFS_PORT=8020
#VAR_DB_LOGS_JDBC_URL=jdbc:hive2://192.168.0.3:21050/;auth=noSasl
#VAR_DB_LOGS_JDBC_DRIVER=org.apache.hive.jdbc.HiveDriver
#VAR_DB_LOGS_USER_NAME=cloudera
#VAR_DB_LOGS_PW=cloudera
#VAR_TABLE_REQUIRES_REFRESH=Y
#VAR_DI_LOG_FILE_PATH=/user/hive/warehouse/logs.db/di_process_log/di_process_log.txt
#VAR_PDI_TEXT_DELIMITER=$[01]
#VAR_PDI_TEXT_ENCLOSURE=

# Setup for vanilla Apache Hadoop cluster with Hive
#VAR_HDFS_HOST=localhost
#VAR_HDFS_PORT=8020
#VAR_DB_LOGS_JDBC_URL=jdbc:hive2://localhost:10000/default
#VAR_DB_LOGS_JDBC_DRIVER=org.apache.hive.jdbc.HiveDriver
#VAR_DB_LOGS_USER_NAME=
#VAR_DB_LOGS_PW=
#VAR_TABLE_REQUIRES_REFRESH=N
#VAR_DI_LOG_FILE_PATH=/user/hive/warehouse/logs.db/di_process_log/di_process_log.txt
#VAR_PDI_TEXT_DELIMITER=$[01]
#VAR_PDI_TEXT_ENCLOSURE=

# Setup for PostgreSQL
#VAR_HDFS_HOST=
#VAR_HDFS_PORT=
#VAR_DB_LOGS_JDBC_URL=jdbc:postgresql://localhost:5432/test
#VAR_DB_LOGS_JDBC_DRIVER=org.postgresql.Driver
#VAR_DB_LOGS_USER_NAME=postgres
#VAR_DB_LOGS_PW=postgres
#VAR_TABLE_REQUIRES_REFRESH=N
#VAR_DI_LOG_FILE_PATH=/tmp/di_process_log.txt
#VAR_PDI_TEXT_DELIMITER=|
#VAR_PDI_TEXT_ENCLOSURE=
A brief walkthrough of the process:
- First we load the project variables.
- Then we create an empty file which will store the logging data in.
- Next we check if a process is already running and abort if this is the case. In order to check if a process is running, we have to query
logs.vw_di_process_logwhich in turn querieslogs.di_process_log. Earlier on we created the table definition for this log data, but at this stage no underlying file was available. As you might know, you cannot just query a table which has no file available in its data folder, as otherwise you will get an error. Hence we created the file in the previous step. - At this stage we know that it is save to execute a new process, so we write a record into the logging table indicating that we will start a new process.
- Next we evaluate if the process to execute is a job or a transformation and based on the result we excute the correct job entry (Execute Job vs Execute Transformation).
- If any of these ones fail, we write an error record into the logging table/file and abort the process.
- If any of these one succeed, we write a success record into the logging table/file and mark the wrapper job as succeeded.
Check If A Process Is Running
Name: tr_check_process_running
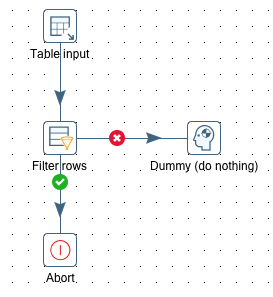
This is a fairly simple process: We use the below listed SQL query to determine if a process of the same name is still running and Abort the job if this is the case. This will ultimately abort the wrapper job as well.
SELECT
  COUNT(*) AS no_of_processes_running
FROM logging.vw_di_process_log
WHERE
  di_process_name = '${VAR_DI_PROCESS_NAME}'
  AND di_process_status = 'running'
Log Process As Running
Name: tr_log_process_as_running:
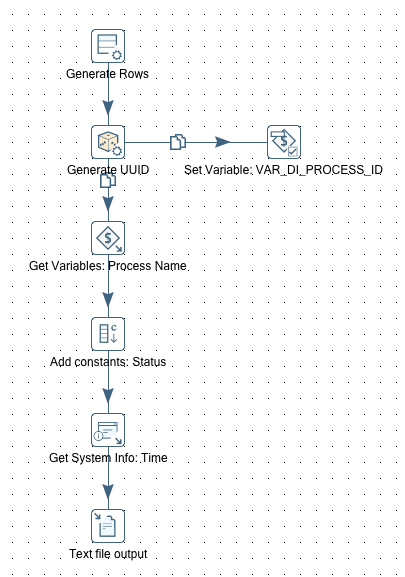
- We create a unique identifier for this execution (we use a UUID for this purpose).
- We set the variable
VAR_DI_PROCESS_IDto the value of the UUID so that it is available for all the other jobs and transformation. We will need it later on when we log the next status. - We get the value of the
VAR_DI_PROCESS_NAMEvariable. - We define a field called
statuswith the valuerunning. - We retrieve the current system time.
- We write all these values into the logging table/file.
Log Process As X (Generic Approach)
Name: tr_log_process_as_x:
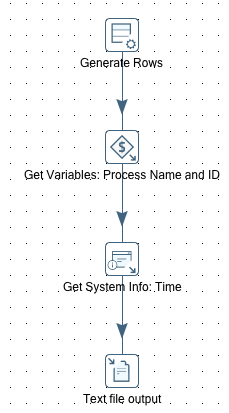
This transformation is very flexible: It accepts as parameters the process name (VAR_DI_PROCESS_NAME) as well as the process status (VAR_DI_PROCESS_STATUS). The process id value is retrieved from the VAR_DI_PROCESS_ID variable we set earlier on in the tr_log_process_as_running transformation. All these values get written to the logging table/file.
Passing Parameters To The Processes: The Parameter Object
So we are facing a bit of a challenge in regards to passing parameters from the wrapper job to the actual process (job or transformation) that we want to execute. As we are planning to run a variety of processes all with their own set of possible parameters it does not make any sense to specify all these parameters in the wrapper job: First of all because there could hundreds of parameters and second of all we probably wouldn’t know all of them upfront.
We will pass a stringified JSON object as a parameter to the wrapper job, which in turn will unwrap it and set the properties as variables. In the process that we want to execute we also have to add some special logic. The approach is outlined in detail in my blog post Pentaho Data Integration: The Parameter Object and replacing Parameter Values with Variable Values, so I will not cover it here again.
The main changes we have to make to our current process:
- Amend
jb_master_wrapper: Add a parameter calledVAR_PARAMETER_OBJECTand set its value to{"VAR_DATE":"2016-02-01","VAR_CITY":"London"}. - Just before the Set Variables job entry add a new Execute Transformation job entry.
-
Create a new transformation called
tr_obj_string_to_varsand reference it in the Execute Transformation job entry we just added tojb_master_wrapper.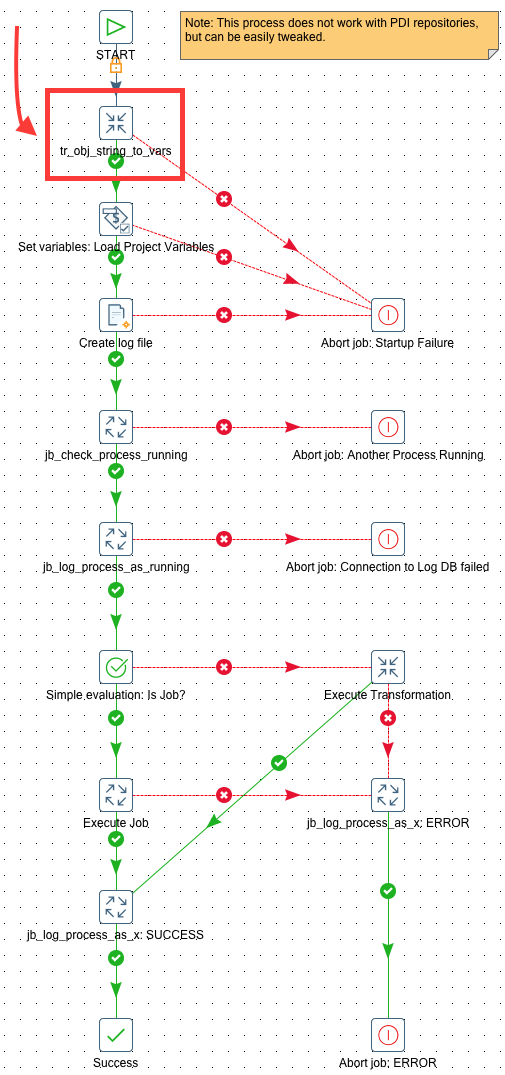
- The setup of
tr_obj_string_to_varsis pretty much the same as outline in my blog post Pentaho Data Integration: The Parameter Object and replacing Parameter Values with Variable Values, so please look there for the details. The only difference is that the parameter name we pass into the Get Variables step is now calledVAR_PARAMETER_OBJECT. Also change the file reference in the Get XML Data step from${Internal.Job.Filename.Directory}/${Internal.Job.Filename.Name}to${VAR_DI_PROCESS_FILE_PATH}. This way it will work both with job and transformation files. -
Finally amend any of the main processes which have to take into account the variables we set in the wrapper job. This can be easily done by defining a mapping in the Job or Transformation Settings. As an example, in our case we adjust the dummy job
jb_sample: We define the two parameters as shown below:Parameter Default Value VAR_CITY${VAR_CITY_OUTER}VAR_DATE${VAR_DATE_OUTER}As you can see we map the sample job specific parameters to the ones set in the wrapper by the JavaScript step. This is all that has to be done to make this working. Easy.
- Still in
jb_sample: Add a Write to Log job entry and have it output the two variables. (This is just for QA purposes)
Now have jb_master_wrapper execute jb_sample and then study the log to understand if the parameter values were passed down to the job.
Finishing touches
We also create a shell file to execute one specific job (as an exmaple):
#!/bin/bash

# simulating properly set up env
export PDI_ROOT_DIR=/Applications/Development/pdi-ce-6.0.1
export PROJECT_ROOT_DIR=/Users/diethardsteiner/Dropbox/Pentaho/Examples/PDI/logging-on-hadoop

cd $PDI_ROOT_DIR

sh ./kitchen.sh -file=$PROJECT_ROOT_DIR/di/jb_master_wrapper.kjb \
-param:VAR_PROPERTIES_FILE=$PROJECT_ROOT_DIR/config/project.properties \
-param:VAR_DI_PROCESS_NAME='sample job' \
-param:VAR_DI_PROCESS_FILE_PATH=$PROJECT_ROOT_DIR/di/jb_sample.kjb \
-param:VAR_PARAMETER_OBJECT='{"VAR_DATE":"2016-02-01","VAR_CITY":"London"}' \
> /tmp/jb_sample.err.log
You can download the PDI jobs and transformation from here.
Special Case: PostgreSQL for testing the framework
For those wanting to go down the PostgreSQL route, I shall quickly provide the setup for the foreign data wrapper (more detailed info on this excellent blog post):
CREATE SCHEMA logs;
CREATE EXTENSION file_fdw;
CREATE SERVER file_fdw_server FOREIGN DATA WRAPPER file_fdw;

CREATE FOREIGN TABLE logs.di_process_log
(
  di_process_id VARCHAR(70)
  , di_process_name  VARCHAR(120)
  , di_process_status VARCHAR(20)
  , creation_time TIMESTAMP
)
SERVER file_fdw_server
OPTIONS (
	format 'text'
	, filename '/tmp/di_process_log.txt'
	, delimiter '|'
	, null '\N'
)
;

-- you will have to create the log file at this stage

CREATE VIEW logs.vw_di_process_log AS
SELECT
  di_process_id
  , di_process_name
  , current_status AS di_process_status
  , start_time
  , end_time
  , COALESCE(
      ( end_time - start_time )
      , ( NOW() - start_time)
    ) AS duration_minutes
FROM (
  SELECT
    di_process_id
    , di_process_name
    , di_process_status
    , COALESCE(
        LEAD(di_process_status, 1) OVER (PARTITION BY di_process_id ORDER BY creation_time)
        , di_process_status
      ) AS current_status
    , creation_time AS start_time
    , LEAD(creation_time, 1) OVER (PARTITION BY di_process_id ORDER BY creation_time) AS end_time
  FROM logs.di_process_log
) a
WHERE
  /* keep first record only */
  di_process_status = 'running'
ORDER BY start_time DESC
;
Values for the properties file:
# Setup for PostgreSQL
VAR_DB_LOGGING_NAME=logs
VAR_TABLE_CUSTOM_PDI_LOGS=di_process_log
VAR_HDFS_HOST=
VAR_HDFS_PORT=
VAR_DB_LOGS_JDBC_URL=jdbc:postgresql://localhost:5432/test
VAR_DB_LOGS_JDBC_DRIVER=org.postgresql.Driver
VAR_DB_LOGS_USER_NAME=postgres
VAR_DB_LOGS_PW=postgres
VAR_TABLE_REQUIRES_REFRESH=N
VAR_DI_LOG_FILE_PATH=/tmp/di_process_log.txt
VAR_PDI_TEXT_DELIMITER=|
VAR_PDI_TEXT_ENCLOSURE=