Note: Written Dec 2016, put on hold because of some issues faced when using file based (as opposed to repo) approach. Since I do not have time for now to revisit the topic, I’ll publish it (Apr 2017) in any case, because the article should contain quite a lot of useful info regardless of the issues faced. I recommend using the repo for now.
I was probably not the only one who wondered what was behind the Streamlined Data Refinery (SDR) marketing buzz. So what is it then? Really?
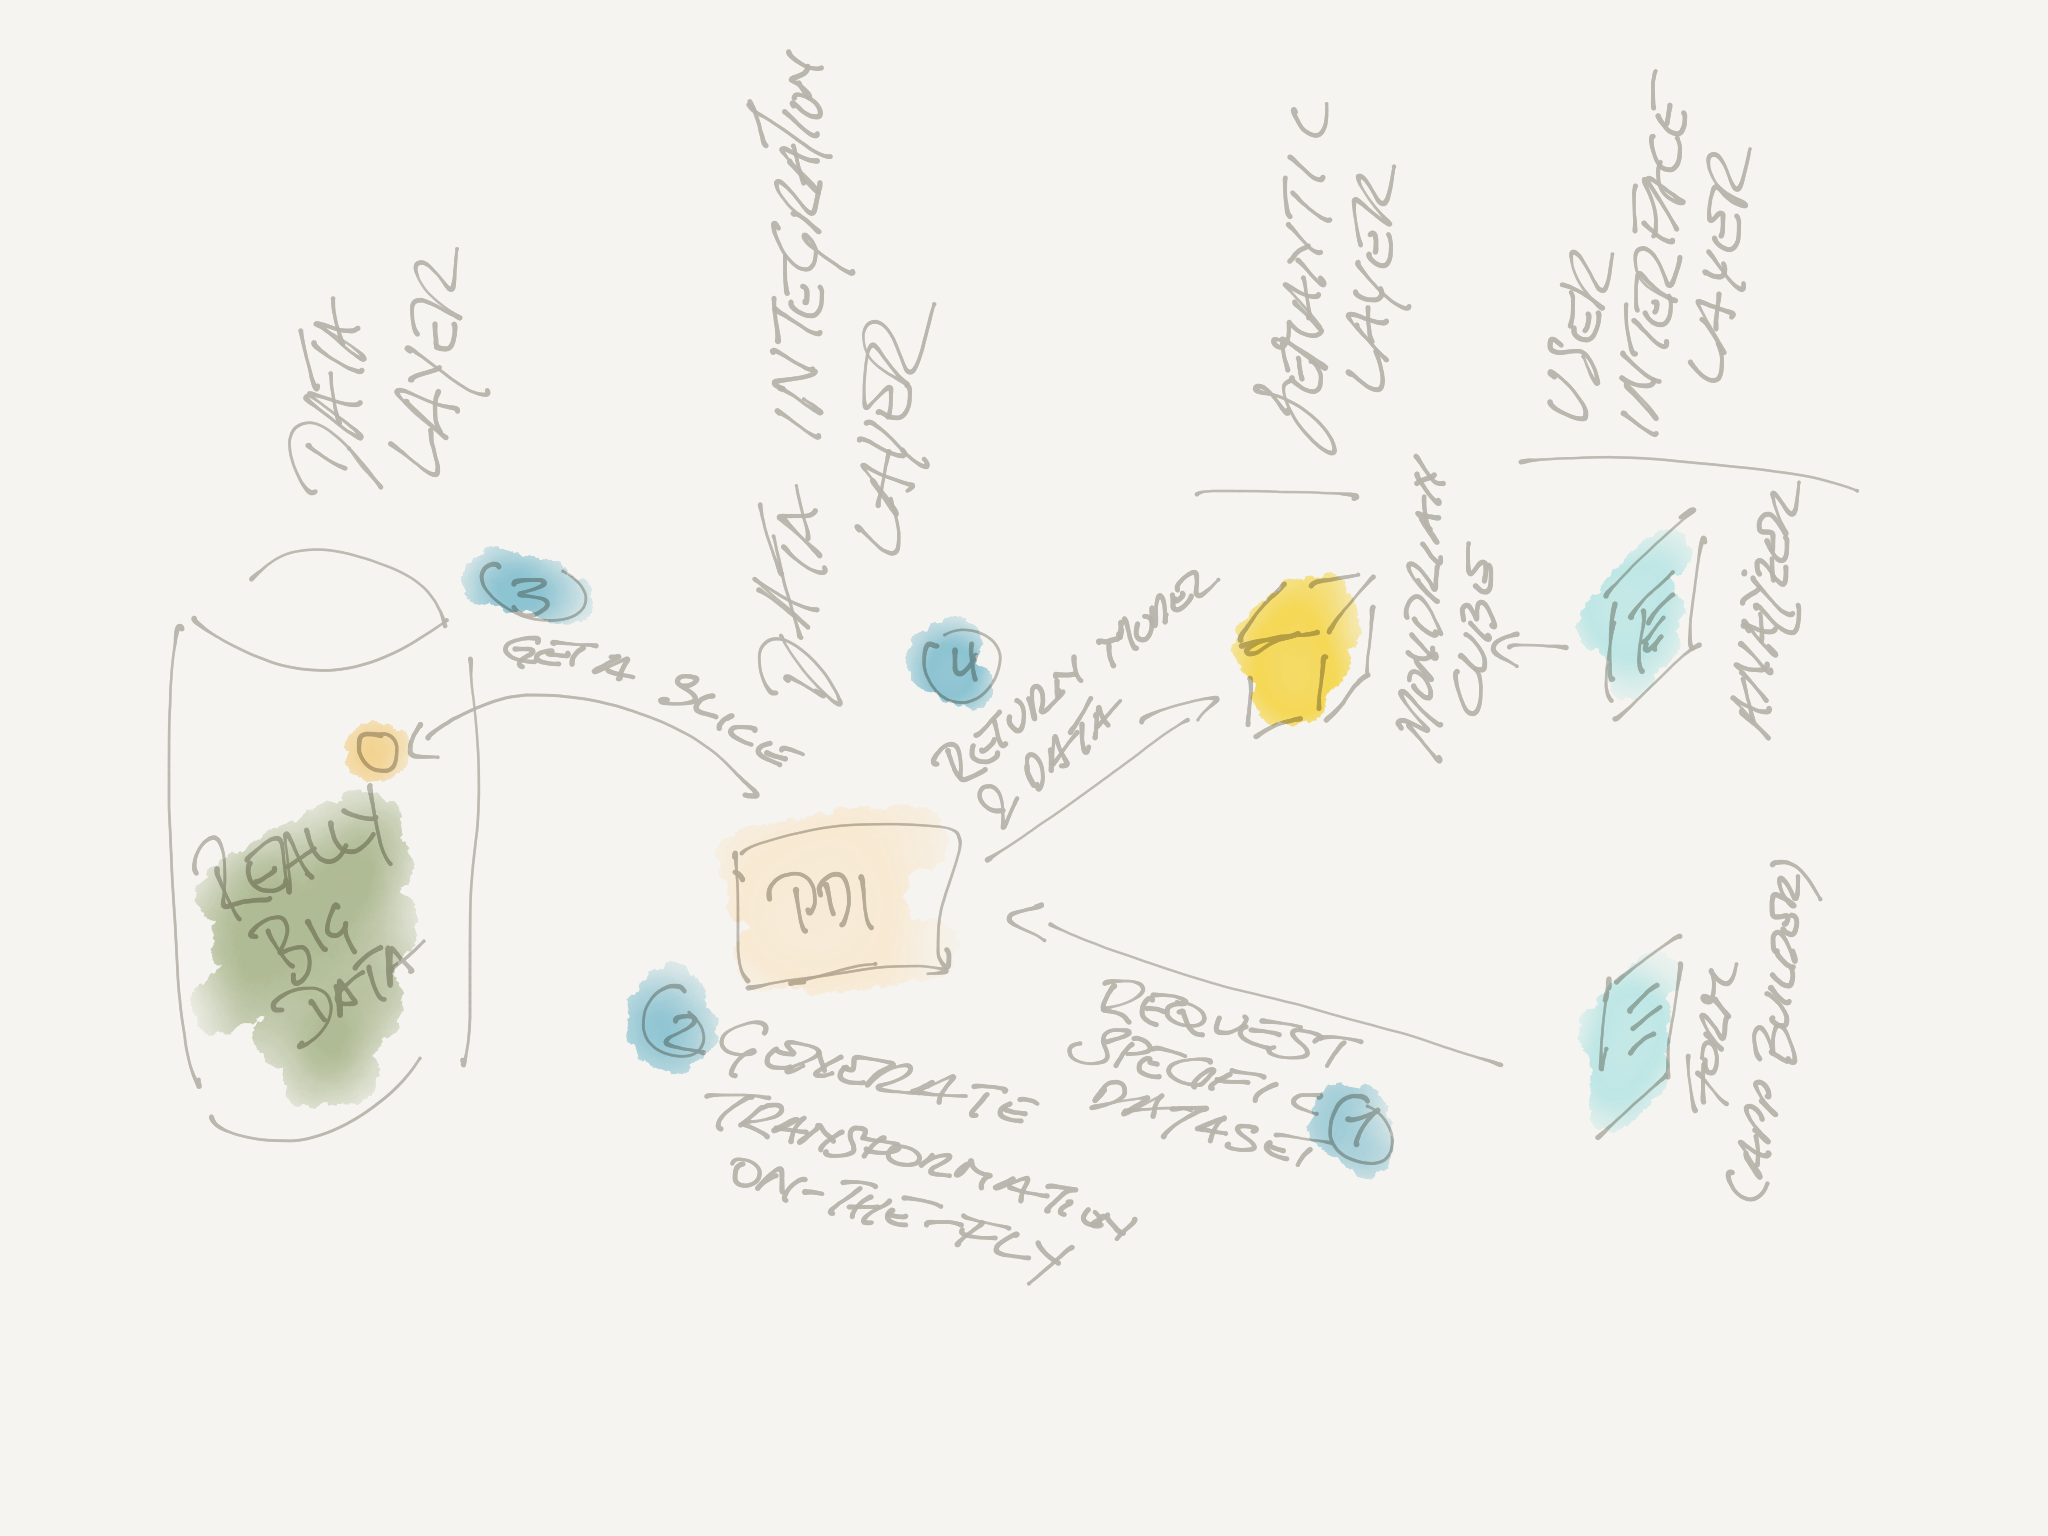
SDR is mainly an answer to the need of exploring Big Data. While not necessarily limited to Big Data, SDR enables companies to offer on-demand custom analytical solutions which get automatically generated. Now this sounds a bit vague: Ultimately what this burns down to is allowing the end user to choose and pick certain attributes from a dataset via a form, which triggers in the background the preparation of data and automatic generation of a model (semantic layer) which will be made available to the end user for exploration. The form is based on App Builder (previously known as Sparkl, a plugin for the Pentaho Server) and the data prep and model generation by PDI (previously known as Kettle), Pentaho’s Data Integration component. The automatically generated solution gets published to the Pentaho Server, which offers a web front-end to explore the data. SDR is a showcase of Pentaho’s ambition to tightly integrate all the various components.
Within PDI, following steps and job entries were added to support SDR:
- Annotate Stream (transformation step)
- Shared Dimension (transformation step)
- Build Model (job entry)
- Publish model (job entry)
Those of you who have every create a Cube (Mondrian schema) will know that dimensions and measures usually get defined at the very end of our work flow. The Annotate Stream step completely changes this approach by allowing you the enrich the data stream within PDI with metadata like dimensions and measures.
When you configure the step settings, you have the option to store the annotations locally or as a shared artefact (the latter option allowing you to use the annotations with any other transformation). The easiest way to define the annotations is to click on the Select Fields button, which will auto-populated the annotations table. Then simply double click on the first row, which will open the Annotate dialog. For each field you can define the details:
- Create Attribute: In the classic Mondrian world this is called a Level of a dimension. In the list of details to provide you will find Dimension and Hierarchy. Note that there is no separate dialog to define these, just simple type in the values (ignore the drop down when creating them the first time round). Once to move on to other fields, existing dimension and hierarchy values will then be available in the drop-down menu.
- Create Measure
- Create Linked Dimension
The result of providing these annotations becomes a lot quicker available these days by using the DET (Data Exploration Tool), which in simple words builds a cube and makes the data available for visual analysis à la Analyzer. Basically you can check to output of each step in your transformation via this new feature, which is only available in the Enterprise Edition. If you use the Community Edition, there is currently no such feature available.
Enriching the Stream
Simple Example
Let’s start with a very simple example, a transformation called tr_sdr_fact_sales: Imagine you have some sales data as shown in the below screenshot and want to enrich the stream with some cube attributes:
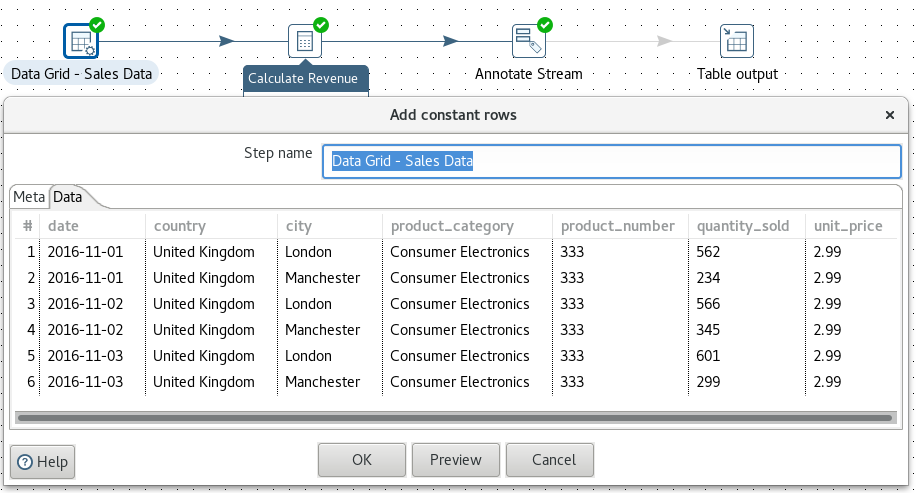
Add an Annotate Stream step and double click on it. Click on Select Fields at the bottom of the dialog box and select the all fields except unit_price. Then double click on the first row in the Annotations table.
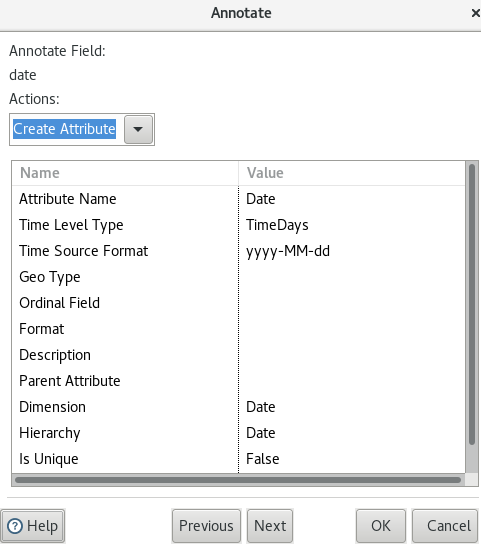
For the date field we choose Create Attribute because it is a dimensional Level:
- Define the Attribute Name as
Date. - Pick
TimeDaysas Time Level Type from the pull down menu. - Set Data Source Format to
yyyy-MM-dd. - For Dimension provide following value:
Date(so do not use the pull down menu but hard code the value - this is only require the first time you mention the dimension. If a dimensions has more than one attribute, you can pick the dimension name then from the pull down menu). - Next hard code the Hierarchy as
Date(same principles apply to the hierarchy in regards to defining the name as for the dimension):
Click Next.
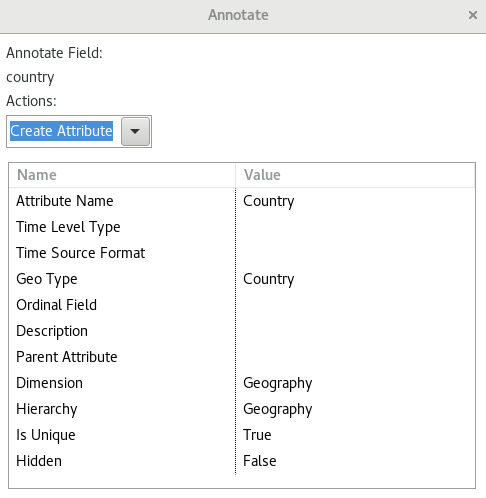
For the country field we choose Create Attribute because it is a dimensional Level:
- Define the Attribute Name as
Country. - Pick
Countryas Geo Type from the pull down menu. - For Dimension provide following value:
Geography. - Next hard code the Hierarchy name to
Geography. - Set Is Unique to
True.
Click Next.
For the city field we choose Create Attribute because it is a dimensional Level:
- Define the Attribute Name as
City. - Pick
Cityas Geo Type from the pull down menu. - Because
cityis a child ofcountryin our dataset, defineCountryas the Parent Attribute. - Now instead of hard coding the value for the Dimension pick
Geographyfrom the pull down menu. - Pick
Geographyfrom the pull down menu as Hierarchy name.
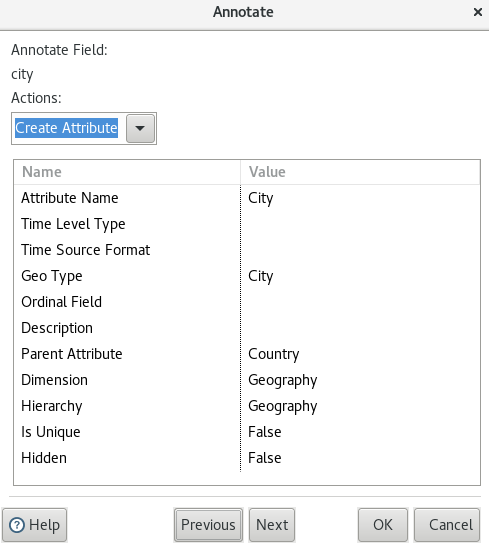
Click Next.
For the product_category field we choose Create Attribute because it is a dimensional Level:
- Define the Attribute Name as
Product Category. - Hard code
Product Categoryas Dimension value. - Next hard code the Hierarchy name to
Product: - Set Is Unique to
True.
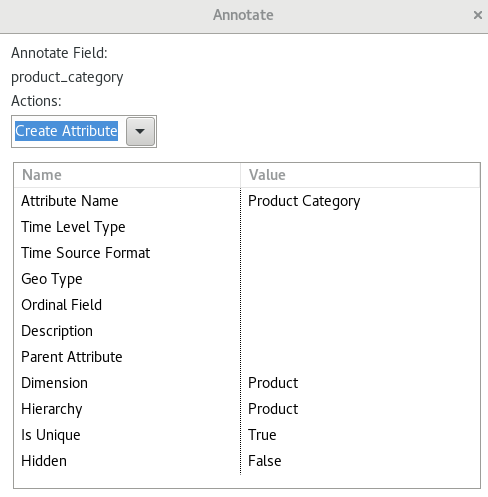
Click Next.
For the product_number field we choose Create Attribute because it is a dimensional Level:
- Define the Attribute Name as
Product Number. - Because
product_numberis a child ofproduct_categoryin our dataset, defineProduct Categoryas the Parent Attribute. - Now instead of hard coding the value for the Dimension pick
Productfrom the pull down menu. - Pick
Productfrom the pull down menu for Hierarchy. - Set Is Unique to
True
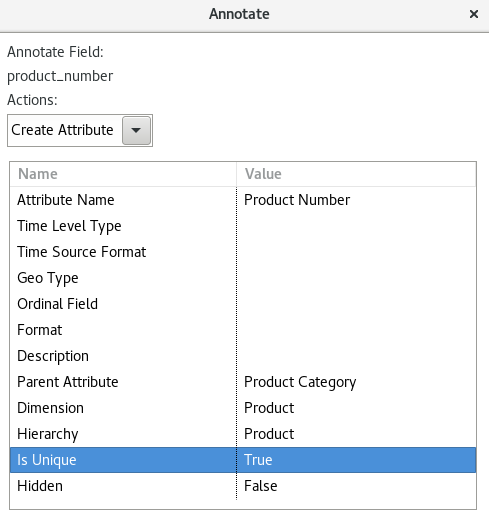
Click Next.
For the quantity_sold field we choose Create Measure:
- Define
Quantity Soldas Measure Name. - Pick
SUMfrom the pull down menu for Aggregation Type. - Pick
#,##0from the pull down menu for Format.
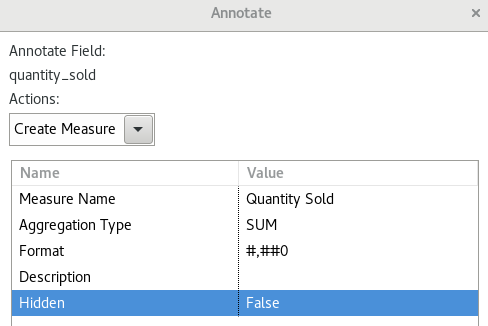
Click Next.
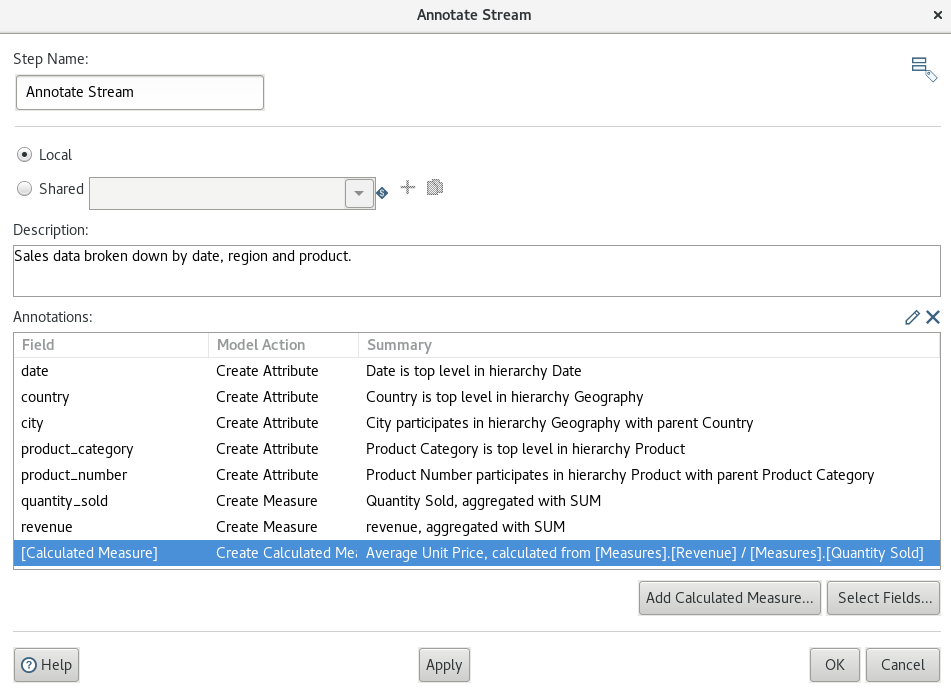
Set the annotations for the revenue field up in a similar fashion. Then click OK.
Next we will create a calculated measure, so click on the Add Calculated Measure button:
- Define
Average Unit Priceas Measure Name. - Set the Format to
#,###.00. - Set the Formula to
[Measures].[Revenue] / [Measures].[Quantity Sold]. The formula is based on MDX.
Click OK. You can edit the definitions at any point by double clicking on the respective row.
After providing all these annotations, it would be quite interesting to see what advantages we can obtain with enriching the stream. In the PDI Enterprise Edition you can instantly see the benefits by highlighting the Annotations step and then clicking on the blue Play icon (with a chart in the background) to load the DET (Data Exploration Tool) perspective.
For those using the Community Edition, you can still see quite some benefit by publising the model to the BA Server (the same functionality is available in the Enterprise Edition as well). We will take a look at this a bit later on.
Creating a Shared Dimension
Now it gets a bit more interesting! Certain dimensions like date lend itself very well to being define on a global level, so that you can reuse the definition in various cubes. PDI enables you to create one by using the Shared Dimension step (you guessed it!).
Again we will create a very basic transformation called tr_sdr_dim_date for a shared date dimension. For this example we auto-generate some data like this:
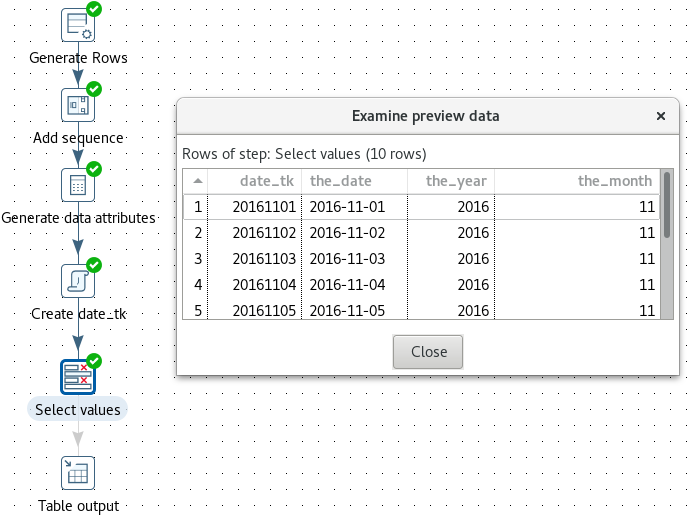
Next add an Annotate Stream step between the Select values and Shared Dimension step. Configure the step settings:
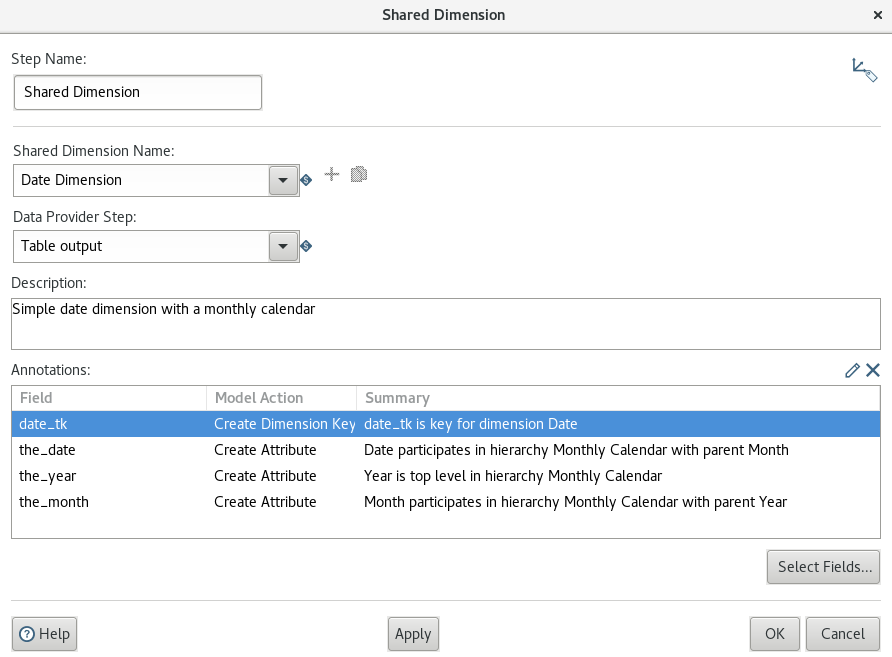
- Define
Date Dimensionas Shared Dimension Name. In this case we hard code the name, however, you can also base your new shared dimension on an existing one by selecting the name from the pull down menu. - From the pull down menu select
Table outputfor the Data Provider Step. Now this might not seem a 100% intuitive at first because the Table output step is located downstream. Note that only a few steps are supported so far to serve as Data Provider (Combination Lookup, Database Lookup, Dimension Lookup, Insert/Update, Table Output, Vertica Bulk Loader). - Next click on the Select Fields button and select all of the fields.
- The annotation table is populated now with the selected fields. Double click on the first row.
For the field date_tk define the following:
- Actions:
Create Dimensions Key - Hard code
Dateas Dimension name.
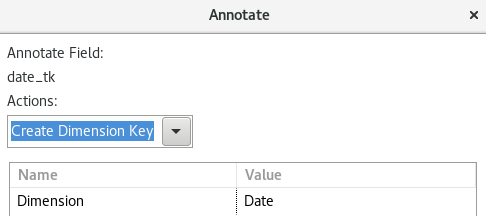
Click Next.
Set the annotations for field the_date up as shown below:
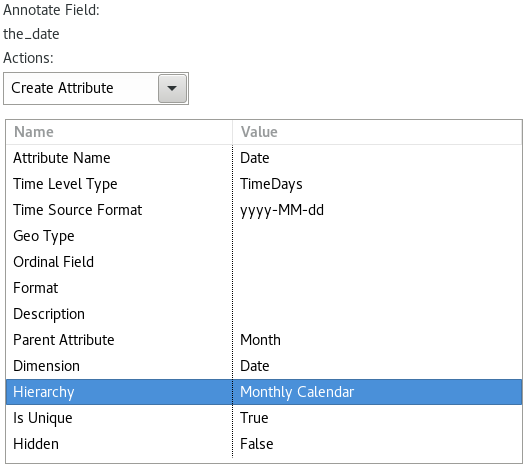
Click Next.
Set the annotations for field the_year up as shown below:
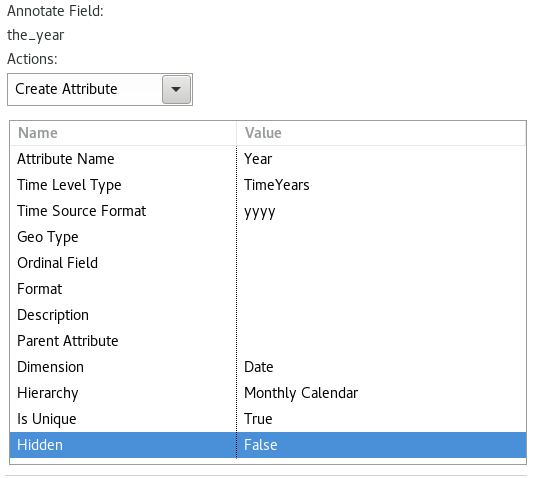
Click Next.
Set the annotations for field the_month up as shown below:
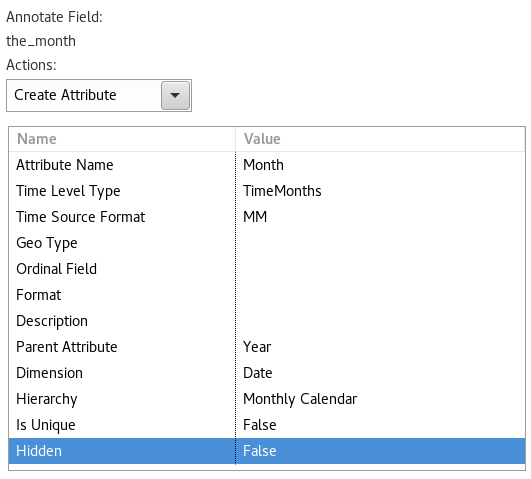
Click OK. The definition of the shared dimension should look like this now:
You might be wondering where the definition of the shared dimension gets stored if you are using a file based (non repository) setup: It is part of the Metastore, which resides by default under:
$ ls ~/.pentaho/metastore/pentaho/SharedDimensionGroup/
'Date Dimension.xml'
The location of the Metastore can be configured via the PENTAHO_METASTORE_FOLDER environment variable. You will have to change spoon.sh to take this variable into account. Simple add ` -DPENTAHO_METASTORE_FOLDER=$PENTAHO_METASTORE_FOLDER to the end of the OPT=` section:
Before:
OPT="$OPT $PENTAHO_DI_JAVA_OPTIONS -Dhttps.protocols=TLSv1,TLSv1.1,TLSv1.2 -Djava.library.path=$LIBPATH -DKETTLE_HOME=$KETTLE_HOME -DKETTLE_REPOSITORY=$KETTLE_REPOSITORY -DKETTLE_USER=$KETTLE_USER -DKETTLE_PASSWORD=$KETTLE_PASSWORD -DKETTLE_PLUGIN_PACKAGES=$KETTLE_PLUGIN_PACKAGES -DKETTLE_LOG_SIZE_LIMIT=$KETTLE_LOG_SIZE_LIMIT -DKETTLE_JNDI_ROOT=$KETTLE_JNDI_ROOT"
After:
OPT="$OPT $PENTAHO_DI_JAVA_OPTIONS -Dhttps.protocols=TLSv1,TLSv1.1,TLSv1.2 -Djava.library.path=$LIBPATH -DKETTLE_HOME=$KETTLE_HOME -DKETTLE_REPOSITORY=$KETTLE_REPOSITORY -DKETTLE_USER=$KETTLE_USER -DKETTLE_PASSWORD=$KETTLE_PASSWORD -DKETTLE_PLUGIN_PACKAGES=$KETTLE_PLUGIN_PACKAGES -DKETTLE_LOG_SIZE_LIMIT=$KETTLE_LOG_SIZE_LIMIT -DKETTLE_JNDI_ROOT=$KETTLE_JNDI_ROOT -DPENTAHO_METASTORE_FOLDER=$PENTAHO_METASTORE_FOLDER"
Note: When building the Model on the job level, the transformations that build the shared dimenions have to be run before the Model is built.
Next we have to adjust our fact transfromation. Let’s save a new version of tr_fact_sales.ktr as tr_fact_sales_with_shared_dim.ktr. We add a User defined Java Expression to the date technical key (date_tk):
Integer.parseInt(new java.text.SimpleDateFormat("yyyyMMdd").format(date))
Next double click on the Annotate Stream step. Highlight the the_date row in the Annotations table and click on the Delete (x) icon in the top right corner.
Click on the Select Fields button and add the date_tk field. Click OK.
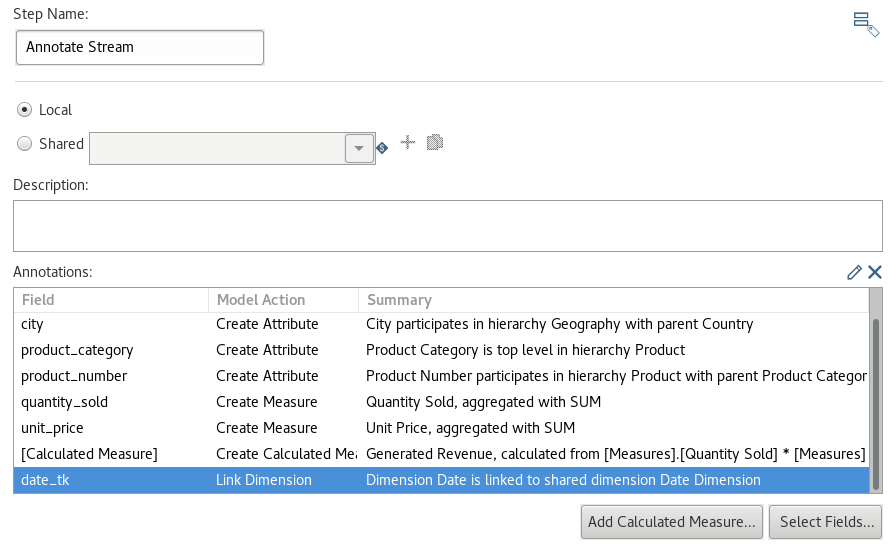
Double click on the date_tk record in the Annotations table.
- Pick
Linked Dimensionfrom the pull-down menu as Actions. - Hard code
Dateas Dimension Name. - Pick
Date Dimensionfrom the pull-down menu as Shared Dimension. Click OK.
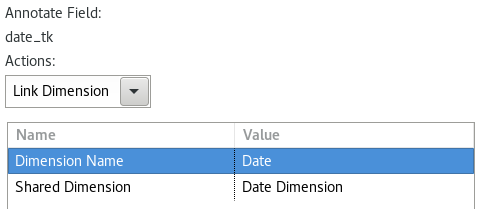
The settings should look like this now:
Next enable and configure the Table output steps in all transformations.
If you have the EE version, you can already do a preview the model defined in tr_fact_sales_with_shared_dim.ktr in DET (Data Exploration Tool). Note that you will have to run tr_sdr_dim_date.ktr so that the database table is populated.
[OPEN]
Important: DET does not work yet with shared dimensions. Pedro Alves explains: “Dataservices don’t support joins yet, which is something we need to do.”
Building and Publishing the Model
I’ve mentioned before that we will eventually build and publish the model. So let’s just clarify what the model actually is: The term model here refers to the semantic layer: There is currently support for Mondrian schemas/cube, but the general consensus is that PDI could support other semantic layers as well.
Build a job which looks like the one shown below:
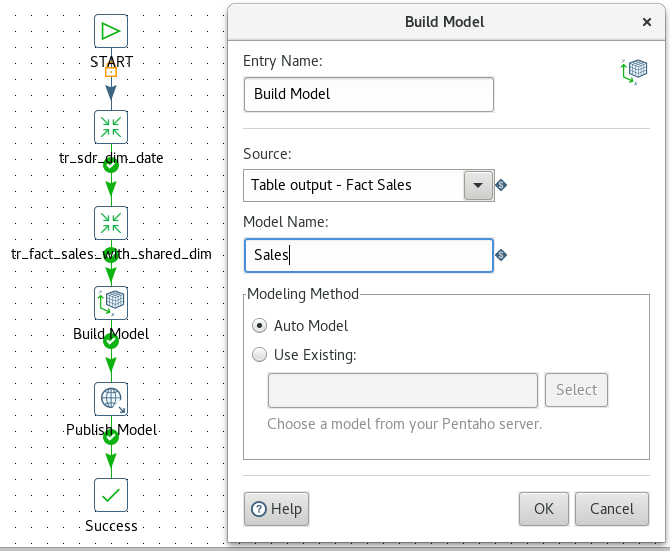
Then double click on the Build Model job entry and inspect the entries in the Source pull down menu. You will see Table output listed twice. At this point it becomes apparent that we have to rename the Table output steps in our transformations to uniquely identify them. So rename one to Table output - Fact Sales and the other one to Table output - Dim Date. Once this is done, go back to the Build Model settings and pick Table output - Fact Sales from the Source pull down menu and set Model Name to Sales. Leave all other setting on their defaults.
Next double click on the Publish Model job entry. We will use parameters to make the setup as flexible as possible:
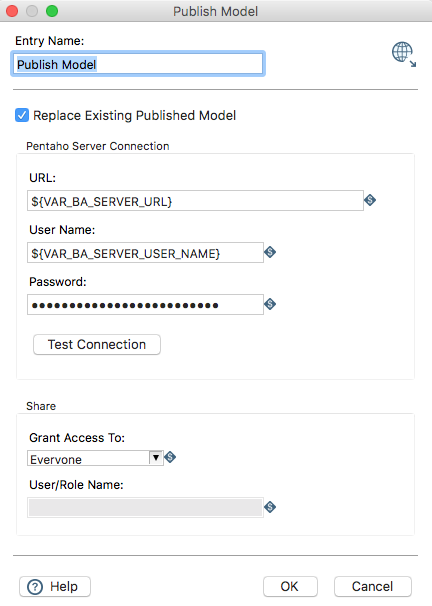
Note that in this dialog you can also define the security for your model (on a basic level).
Since everything should be set up now, let’s run the job!
2016/11/27 21:56:46 - Publish Model - Publishing to BAServer with URL http://localhost:8080/pentaho/
2016/11/27 21:56:46 - Publish Model - Publishing model name: Sales
2016/11/27 21:56:48 - Data Source - Publish database connection successful for: dwh
2016/11/27 21:56:48 - Publish Model - Read variable JobEntryBuildModel.XMI.DSW.Sales with value true
2016/11/27 21:56:52 - Data Source - Publish DSW successful for: 'Sales'
2016/11/27 21:56:52 - Publish Model - Read variable JobEntryBuildModel.Mondrian.Datasource.Sales with value null
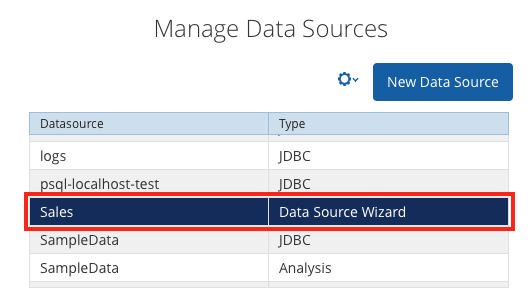
As you can see from the log output above, PDI not only publishes the model but also creates the required database connection on the server as well. If you check the Manage Data Sources dialog on the Pentaho Server (as it is called as of version 7 or in the old lingo BA Server), you will see an entry for Sales. You will realise as well the the Type is set to Data Source Wizzard:
If you edit the entry (click on the wheel icon, then edit) the Data Source Model Editor dialog will pop up:
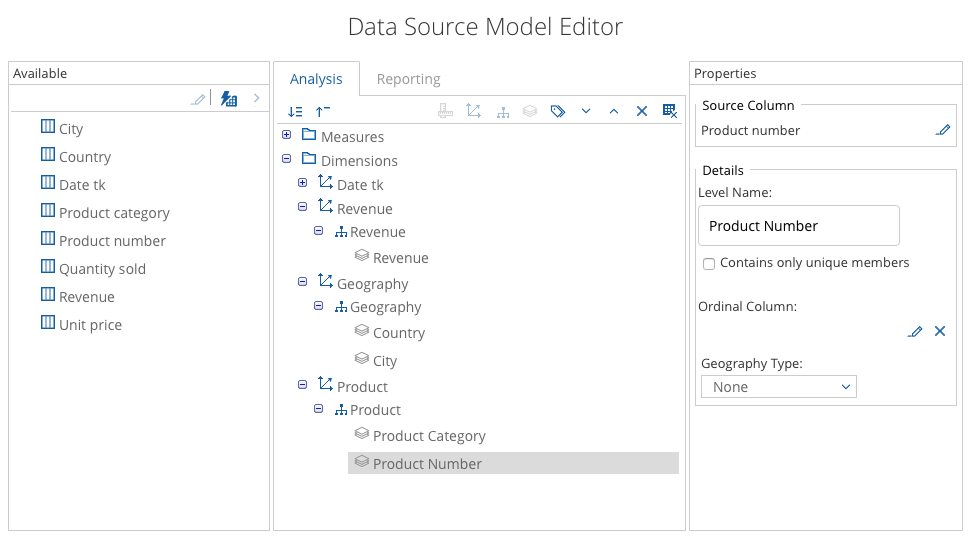
This also shows that there are actually two models: one for Analysis and one for Reporting. The first is to be used with Analyzer or Saiku or any other compatible cube front-end, the latter one with Interactive Reporting.
You can also download the model:
- Click on the row which lists our data model.
- Click on the wheel icon on the top and choose Export.
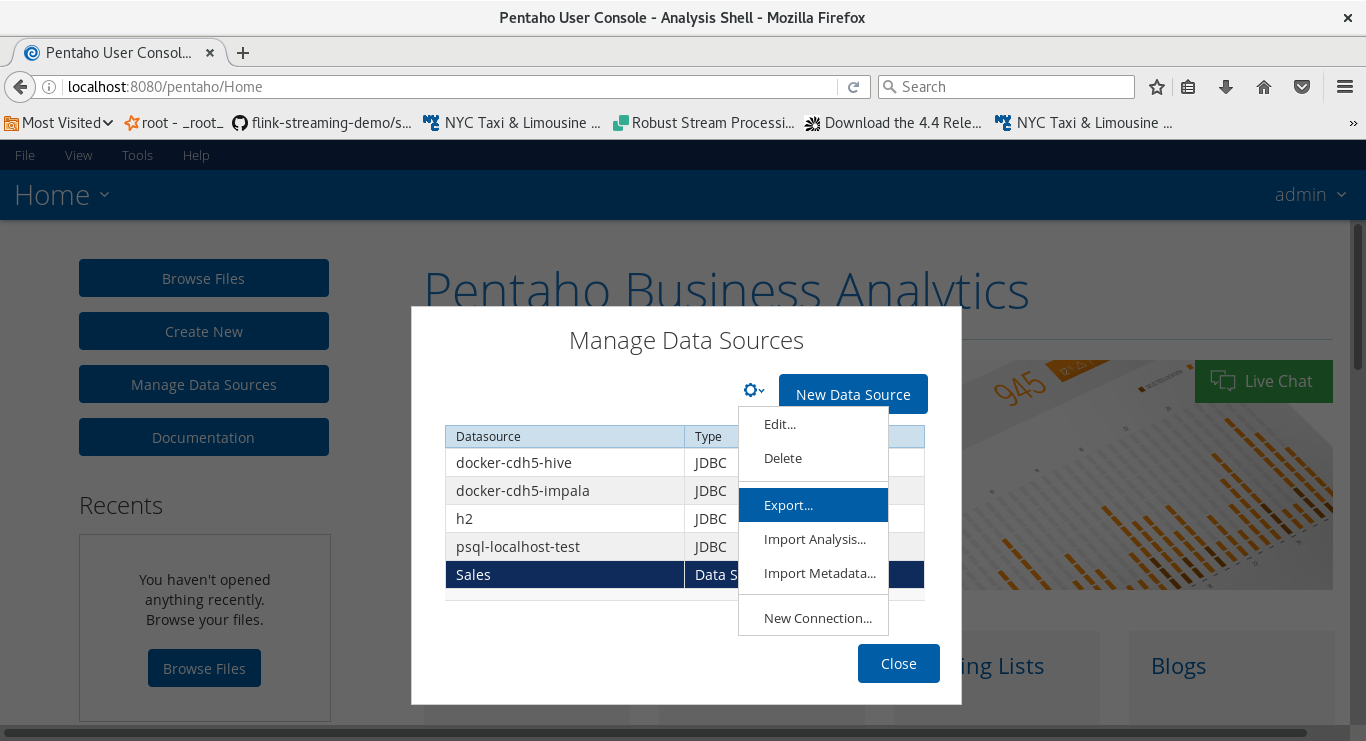
-
A zip file containing both the Mondrian and Metadata model will be downloaded.
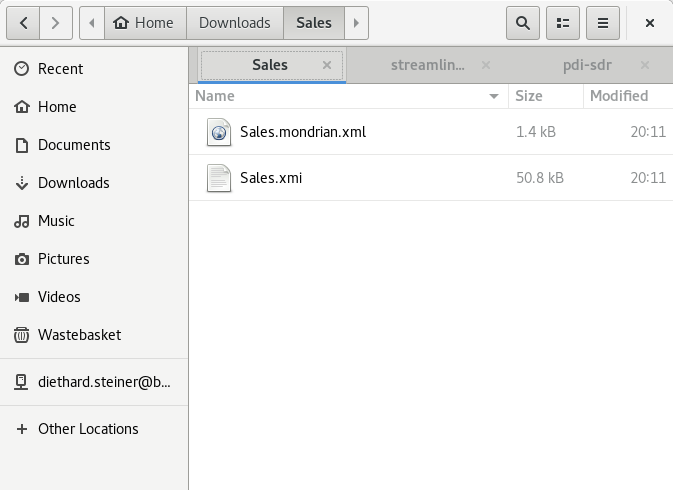
Once you inspect the Mondrian file, you will make some interesting discovery: The Product dimension has been created as global dimension and you can see that DATE_TK is defined as foreignKey?!
<Schema name="Sales">
  <Dimension name="Product">
    <Hierarchy hasAll="true" primaryKey="DATE_TK">
      <Table name="FACT_SALES_ALT"/>
      <Level name="Product Category" uniqueMembers="true" column="PRODUCT_CATEGORY" type="String">
      </Level>
      <Level name="Product Number" uniqueMembers="true" column="PRODUCT_NUMBER" type="Numeric">
      </Level>
    </Hierarchy>
  </Dimension>

...

<Cube name="Sales">
    <Table name="FACT_SALES_ALT"/>
    <DimensionUsage name="Product" source="Product" foreignKey="DATE_TK"/>
    <DimensionUsage name="Date" source="Date" foreignKey="DATE_TK"/>
...
Now clearly the product dimension has nothing to do with date, so how did we end up in this situation? What did we miss? I couldn’t resolve this issue in the file based setup (Dec 2016).
My Thoughts on SDR
Having this synergy between the different products is a real benefit. The ease of creating and publishing a model to the server from within PDI is a real treat. If you then consider that these all the steps support metadata injection and most of the settings of the job entries can be parameter driven, then you realise that the opportunities are vast.
From my point of view SDR is a very interesting concept and has been for the most part nicely implemented by Pentaho. I’ve been working with Pentaho products for over 10 years and SDR brings a lot of advantages, especially an easier way to develop solutions.
Certainly, there is still room for improvement: Not all Cube definitions are supported (e.g. aggregations are missing). What I feel is still a bit a hurdle is that the AppBuilder and PDI are still two compeletely different applications. I can understand that for newbies switching between these two applications when building a SDR solution is a bit of a headache as well as a challenge. Certainly, with the recent announcement of WebSpoon (PDI’s web-interface - a prototype and currently not supported by Pentaho) a tighter integration might be on the horizon within the next 2 to 3 years.
It is clear that SDR has a lot of potential …
Overall though it seems to me that it is still a bit difficult to communicate what SDR actually is. I think you definitely have to demo this to the customer to make the advantages apparent.
Further Documentation
- Installing and Configuring the Streamlined Data Refinery Sample
- Work with the Streamlined Data Refinery
- Streamlined Data Refinery Blueprint
- Use Hadoop with the SDR
- Streamlined Data Refinery with Pentaho Data Integration 5.4
- Publish Calculated Measures from PDI to Analyzer in Pentaho 6.0
Jira Cases
I created a few Jira cases:
- New feature: Auto-Generate CDE-Form for SDR
- Improvement: Annotate Stream step: Change position of row in Annotions table
- Improvement: Publish Model - Write to file option
- Build Model - Option to disable “Auto Model”
- Anntotate Streams: Disable auto-model option
- DET: Support shared dimensions referenced in the Annotate Stream step
- DET: Support Shared Dimensions step
- Annotate Stream step: Reflect upstream field name changes
- Build Model: Shared dimension not picked up