Log4j explained
Mostly copied from here.
Log4J consists of following parts:
- Loggers: Categorise the logging space. Loggers are named entities and follow a hierarchical naming rule, e.g.
com.foo:comis the parent offoo. Loggers may be assigned Levels:TRACE,DEBUG,INFO,WARN,ERRORandFATAL(from very to least verbose). - Appenders: An appender is an output destination, e.g. console, file etc. More than one appender can be attached to a logger. Each enabled logging request for a given logger will be forwarded to all the appenders in that logger as well as the appenders higher in the hierarchy. For example, if a console appender is added to the root logger, then all enabled logging requests will at least print on the console. If in addition a file appender is added to a logger, say C, then enabled logging requests for C and C’s children will print on a file and on the console. So in other words, children inherit appenders defined in the ancestors unless the additivity flag is set to
false. - Layouts: This allows you to define what should go into the line of the log file. This can be configured via patterns.
Configure PDI to log timestamp with millisecond precision
Inside the Community Edition of PDI (v5 or later) you find following folder: plugins/kettle5-log4j-plugin. Open the log4j.xml file lcoated inside this very folder.
Change:
<param name="ConversionPattern" value="%d{yyyy-MM-dd HH:mm:ss} %-5p %c{1}:%L - %m%n" />
...
<level value="NONE"/>
...
<priority value ="NONE"></priority>
To:
<param name="ConversionPattern" value="%d{yyyy-MM-dd HH:mm:ss.SSS} %-5p %c{1}:%L - %m%n" />
...
<level value="INFO"/>
...
<priority value ="INFO"></priority>
Instead of INFO you can also set it to DEBUG if you need more details.
Change the following Kettle Properties:
KETTLE_REDIRECT_STDERR=Y
KETTLE_REDIRECT_STDOUT=Y
KETTLE_DISABLE_CONSOLE_LOGGING=Y
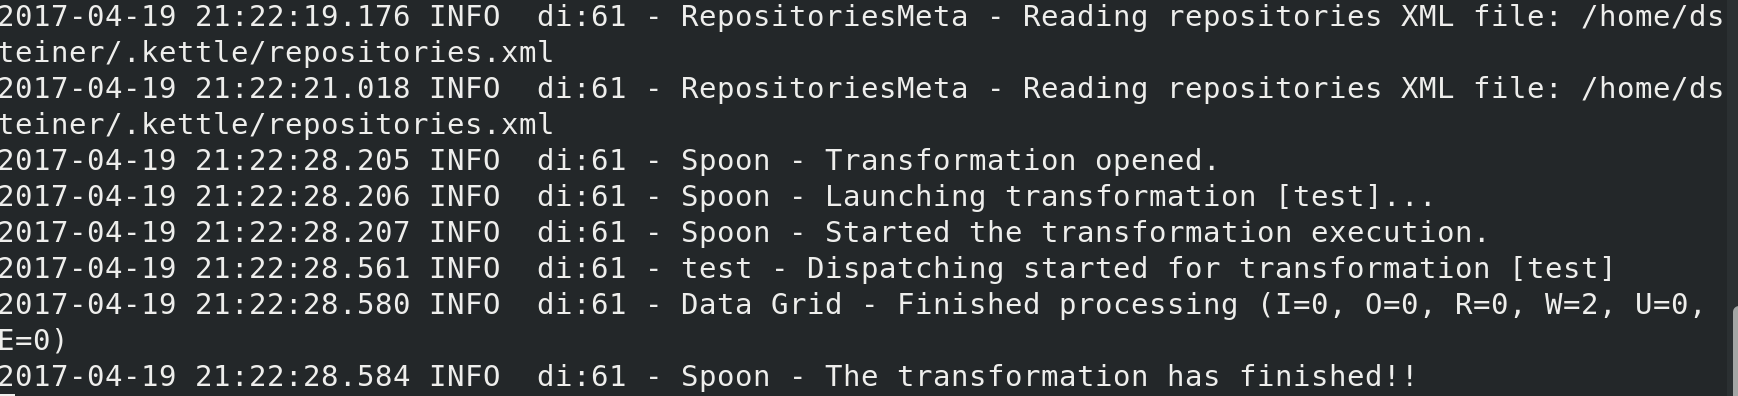
Once you run a job or transformation, the log lines should be printed with milliseconds. When you run Spoon and look at the linked console output, you will notice that other appenders are also publishing details - these appenders write log lines with a different timestamp format.
The mapping of error level from PDI to Log4J is not one to one:
| PDI | Log4J |
|---|---|
| BASIC | INFO |
| MINIMAL | INFO |
| DEBUG | DEBUG |
| ERROR | ERROR |
| DETAILED | INFO |
| ROWLEVEL | DEBUG |
| NOTHING | OFF |
Thanks a lot to Pentaho wizard Alex Schurman for providing these details.
Pentaho Server
Show everything Mondrian is doing
Open the log4j.xml file, which is located in:
tomcat/webapps/pentaho/WEB-INF/classes/log4j.xml
You can see that there are various appenders configured for Mondrian:
<category name="mondrian">
...
<category name="mondrian.mdx">
...
<category name="mondrian.sql">
The first category mondrian prints everything that’s Mondrian related. The other two ones are more specific, logging only the relevant sub-topic.
Here again you can see the hierarchical structure of log4j.
If you want to see absolutely everything logged about Mondrian, enable the first appender.
A lot of other Pentaho products use Log4J, so once you understand the basics for one product, adjusting logging with the other products will be a piece of cake.