Pentaho’s VizAPI comes with the promise to create a custom visualization implementation once and make it accessable across various visualisation tools: Analyzer, PDI Data Explorer (formerly know as PET) and CTools. Develop once and use it everywhere (within Pentaho’s stack). This sounds nice in theory, but does it really live up to this promise? We shall find out in this article: We will try to create a custom D3 Sankey visualisation.
D3 Sankey Sandbox
Note: The code for the example shown below can be found here.
Overview of Library Structure
The Pentaho Platform JavaScript API provides various high level concepts for data handline, visualistation, configuration etc.
The APIs are organized as follows (Source):
- Core
- Environment:
pentaho.environment - Debugging:
pentaho.debug - Utilities:
pentaho.util - JavaScript Language support:
pentaho.lang - Configuration:
pentaho.config - Type information:
pentaho.typeInfo - Instance information:
pentaho.instanceInfo - Localization:
pentaho.i18n - Services:
pentaho.service
- Environment:
- Data:
pentaho.data - Type:
pentaho.type - Visualization:
pentaho.visual
Let’s focus on the Visualisation namespace. This namespace contains the types that constitute the Pentaho Visualization API:
Note: Later on when sourcing the npm module you will realise that this namespace can be found under
node_modules/@pentaho/viz-api/pentaho/visual/.
- action
- Execute
- Select
- Update
- base: The base namespace contains the types used to define the base visualization. Classes:
AbstractModelApplicationModelView
- color:
- Level
- Palette
- PaletteProperty
- config
- models: selection of stock/out-of-the-box visualizations. For example,
pentaho/visual/models/line, is the identifier of the stock Line visualization model. Source. The corresponding CCC-based view of a stock visualization is a sub-module ofpentaho/ccc/visual. For example,pentaho/ccc/visual/line, is the identifier of the CCC view corresponding to the stock Line visualization model. - role: The role namespace contains classes for describing visual roles — an important type of property of visualization models.
- property: The Property class represents a visual role of a visualization and defines its capabilities. A visual role is described by
modesandisVisualKey.
- property: The Property class represents a visual role of a visualization and defines its capabilities. A visual role is described by
- samples
- scene
Getting Started
A visualization is made up of following components (Source):
- One Model, which identifies the visualization and defines it in terms of its data requirements, such as the visual degrees of freedom it has (e.g. X position, color and size) and any major options that affect its rendering.
- One View (at least), which implements the actual rendering using chosen technologies (e.g. HTML, SVG, D3), and handle user interaction, dispatching actions and, for example, showing tooltips. The standard data actions are Select and Execute.
- One HTML page: This is only relevant for development so that you can preview the results.
The Visualization API is built on top of other Platform JavaScript APIs:
-
The Data API ensures seamless integration with data sources in the Pentaho platform, as well as with other client-side component frameworks.
-
The Type API provides to visualizations out-of-the-box features such as class inheritance, metadata support, configuration, validation and serialization.
-
The Core APIs provide to visualizations features such as localization, theming and service registration and consumption.
What calls what?
This is more important for development:
- The HTML pages sources the
package.jsonfile. - The HTML page calls the default view.
- The default view sources the model.
The NPM Package
Make sure you have nodejs and npm installed. There are enough tutorials on the internet on how to install these packages, so I won’t repeat it here.
Create a dedicated project folder in a convenient location and navigate into it (on the command line). Next run:
# Create the package.json file.
npm init
# Accept the default for the other fields or write whatever you want.

# Add and install the Visualization API dev dependency.
# (the runtime dependency is provided by the platform)
npm install https://github.com/pentaho/pentaho-platform-plugin-common-ui/releases/download/v3.0.0-beta3/pentaho-viz-api-v3.0.0.tgz --save-dev

# If you are planning to use D3 for your Viz
# Add and install the D3 dependency
# (also set it as a bundled dependency)
npm install d3 --save --save-bundle
Your package.json file should be similar to the one shown below:
{
  "name": "pentaho-visual-samples-sankey-d3",
  "version": "1.0.0",
  "config": {
    "pentaho/typeInfo": {
      "pentaho-visual-samples-sankey-d3/model": {
        "base": "pentaho/visual/base/model"
      }
    }
  },
  "dependencies": {
    "d3": "^4.13.0",
    "d3-sankey": "^0.7.1"
  },
  "bundleDependencies": [
    "d3",
    "d3-sankey"
  ],
  "devDependencies": {
    "@pentaho/viz-api": "https://github.com/pentaho/pentaho-platform-plugin-common-ui/releases/download/v3.0.0-beta3/pentaho-viz-api-v3.0.0.tgz"
  }
}
Since the D3 Sankey Module is not include dy default in the standard D3 NPM package, we add it like so:
npm install d3-sankey --save --save-bundle
Data
The Viz API expects the data to be supplied as a JSON structure, having a definition of the columns on the top (model section) followed by the rows of data (rows section). Our sample data then looks like this:
{
  "model": [
    {"name": "source", "type": "string", "label": "Source"},
    {"name": "target", "type": "string", "label": "Target"},
    {"name": "value", "type": "number", "label": "Value"}
  ],
  "rows": [
    {"c": ["Barry","Elvis",2]},
    {"c": ["Frodo","Elvis",2]},
    {"c": ["Frodo","Sarah",2]},
    {"c": ["Barry","Alice",2]},
    {"c": ["Elvis","Sarah",2]},
    {"c": ["Elvis","Alice",2]},
    {"c": ["Sarah","Alice",4]}
  ]
}
There is also the option to add further attributes to the cells, e.g. mapping the value to a more readable representation (not related example shown below). In this case, the values have to be in an array and prefixed with an indicator:
{"c": [{"v": "cars-classic", "f": "Classic Cars"}, 2746782]},
For our use case this is not required.
HTML
The HTML page is only used for development and will not be deployed (only the model and the view).
The first require sources the package.json and vizapi-dev-init:
require([
      "vizapi-dev-init",
      "json!./package.json"
    ]
Via require we load from the other Pentaho Platform APIs:
- Context: A class that holds configured types. A type context holds environmental information in the form of an environment.
- Table: The Table class implements the ITable interface.
- And finally we load our JSON data file (just for development)
require([
  "pentaho/type/Context",
  // [API Ref](https://help.pentaho.com/Documentation/8.1/Developer_Center/JavaScript_API/platform/pentaho.type.Context)
  "pentaho/data/Table",
  // [Table](https://help.pentaho.com/Documentation/8.1/Developer_Center/JavaScript_API/platform/pentaho.data.Table)
  "json!./sankey.data.json"  // <= This reads our JSON data file!
], function (Context, Table, dataSpec) {
Using the Context.createAsync method we creates a new context with a given environment and return a promise for it: We get the model and base view types:
// Setup up a VizAPI context.
Context.createAsync({application: "viz-api-sandbox"})
  .then(function (context) {
    return context.getDependencyAsync({
      SankeyModel: "pentaho-visual-samples-sankey-d3/model",
      // pentaho-visual-samples-sankey-d3 is the package name defined in
      // package.js. This is another way of referencing files in the
      // root folder of the the app, like "./model.js"
      BaseView: "pentaho/visual/base/view"
      // this is the path as of node_modules/@pentaho/viz-api/
    });
  })
Using the getDependencyAsync method, which resolves a module dependency reference asynchronously, we get hold of the base model and base view classes:
- We define
SankeyModeland source ourmodel.jsfile in the root folder of our app. To access the root folder, we use thepentaho-visual-samples-sankey-d3shorthandle, which is the appnamedefined in thepackage.jsonfile. - We also source the
BaseView.
Once we have the base model and view classes loaded, we create a Model Specification, which defines the data source as well as the Role Mappings. Roles are e.g. categories and measures:
var modelSpec = {
  "data": new Table(dataSpec),
  // Role Mappings
  "link": {fields: ["source", "target"]},
  "measure": {fields: ["value"]}
};
Important: To catch any error messages, use the
then ... catchapproach (as shown here). Nelson Antunes: “Validation will fail if something is wrong, like missing mandatory fields, incorrect data types, etc. The only exception I remember is if the spec contains unknow fields, which simply are ignored. Meaning: if declare your model as having a field name “colour” but then instantiate it with a spec that spells it ascolor, the value will be ignored and no error thrown. Thecolourfield will remain with its default value. However if that default value is null and the field is required, it should still fail validation and don’t render.”:
.then(
  ...
)
// Catch any error messages
.catch(function(ex) {
  alert("Error: " + ex.message);
});
Then we declare the SankeyModel as a new type:
var model = new types.SankeyModel(modelSpec);
Next we define the Visualistation Specification, which consists of the dom element where the visualisation should be attached to, the size of the vis and the model that goes with it:
var viewSpec = {
  width: 700,
  height: 300,
  domContainer: document.getElementById("viz_div"),
  model: model
};
A few other functions follow (e.g. how handle user selection) and finally the view is loaded.
The Model
Here is are some Visual roles found via the // VISUAL_ROLE comments in the sample files node_modules/@pentaho/viz-api/pentaho/visual/models:
categorycolor(found in sample file:heatGrid.js)columns(found in sample file:categoricalContinuousAbstract.js)multi(found in sample file:categoricalContinuousAbstract.js)measuresrow(found in sample file:abstract.js)size(found in sampe file:bubble.js)x(found in sample file:metricPointAbstract.js)y(found in sample file:metricPointAbstract.js)
Pedro Vale: “As for visual roles, they are visualization specific. There isn’t a closed list of visual roles. They should be defined as needed to map the data model to your viz needs. So, for the Sankey I’d expect to have as Visual Roles Source, Target and Link Strength (or Value) (assuming my tabular representation of the data would be something like you have here <Source, Target, Value>. Category, Series and Measure are the “traditional” visual roles for traditional visualizations. But there’s no reason you can’t create the ones that make more sense to your viz.”
So in regards to the Visual Roles, you can just make up any name. There is no predefined list of Visual Roles you have to pick from. In other words, it can be any name, and it kind of gets its type definition by all the other attributes you add (like isRequired etc). So there is no special meaning associated to the name measure, category etc, but only to whatever other attributes/properties that you add to it.
Data Types:
- list
- number
- string
- array of string etc, defined like so:
["string"] - etc
Some examples see here.
Our model looks like this:
define([
  "module"
], function(module) {
  "use strict";

  return ["pentaho/visual/base/model", function(BaseModel) {
    // Create the Bar Model subclass
    // We extend the **Base Model** with our specific implementation
    var SankeyModel = BaseModel.extend({
      $type: {
        id: module.id,

        // CSS class
        styleClass: "pentaho-visual-samples-sankey-d3",

        // The label may show up in menus
        label: "D3 Sankey Chart",

        // The default view to use to render this visualization is
        // a sibling module named `view-d3.js`
        defaultView: "./view-d3",   // <== DEFINE DEFAULT VIEW

        // Properties
        props: [
          // General properties
          // {
          //   name: "barSize",
          //   valueType: "number",
          //   defaultValue: 30,
          //   isRequired: true
          // },

          // Visual role properties
          {
            name: "link", // VISUAL_ROLE: you can name it anything you like
            base: "pentaho/visual/role/property",
            modes: [
              // {dataType: "list"}
              /* defaults to:
              {dataType: "string"}
              which accepts a single value only
              to accept multiple values use: */
              {dataType: ["string"]}
            ]
            // ordinal: 6
          },
          // {
          //   name: "category",
          //   base: "pentaho/visual/role/property",
          //   fields: {isRequired: true}
          // },
          {
            name: "measure", // VISUAL_ROLE: you can name it anything you like
            base: "pentaho/visual/role/property",
            modes: [{dataType: "number"}],
            fields: {isRequired: true}
          },

          // Palette property
          {
            name: "palette",
            base: "pentaho/visual/color/paletteProperty",
            levels: "nominal",
            isRequired: true
          }
        ]
      }
    });

    console.log(" -----  Generated Model ----- ");
    console.log(SankeyModel);

    return SankeyModel;
  }];
});
Logging the data
Let’s add some logging to understand the structure of the data we are reading in:
// Create the visualization model.
var modelSpec = {
  "data": new Table(dataSpec),
  "link": {fields: ["productFamily"]},
  "measure": {fields: ["sales"]}
};

var model = new types.BarModel(modelSpec);

console.log("----- data -----");              //
console.log(model.data);                      // <= Debug: See the sourced dataset
In the JavaScript console you can the inspect the structure:

As we can see from the log output, the data is differently structured: Instead of a row representation we have a column representation now, which makes it a bit more convenient to work with the data for presentation purposes.
View
Data Transfromation
Our data has to be transformed to the expected D3 Sankey data structure, which consists of an array of unique node names and the links. The links do not actually use the names of the nodes (e.g. Elvis) but the 0-based index (e.g. 2 for Elvis):
{
  "nodes": [
    {
      "name": "Barry"
    },
    {
      "name": "Frodo"
    },
    {
      "name": "Elvis"
    },
    {
      "name": "Sarah"
    },
    {
      "name": "Alice"
    }
  ],
  "links": [
    {
      "source": 0,
      "target": 2,
      "value": 2
    },
    {
      "source": 1,
      "target": 2,
      "value": 2
    },
    {
      "source": 1,
      "target": 3,
      "value": 2
    },
    {
      "source": 0,
      "target": 4,
      "value": 2
    },
    {
      "source": 2,
      "target": 3,
      "value": 2
    },
    {
      "source": 2,
      "target": 4,
      "value": 2
    },
    {
      "source": 3,
      "target": 4,
      "value": 4
    }
  ]
}
The pentaho.visual.scene.Base.buildScenesFlat method is used to transform the VizAPI data into a simplified representation required by D3js:
var scenes = Scene.buildScenesFlat(this).children;
The data structure is still quite rich, so we extract only the required attributes and over several steps transform the data to match the target structure (see code for details).
D3 Sankey Code
Now that we have the data in the right structure, we can focus on generating the final visualisation. The code is based on this example - Pedro Vale (thanks!) and I made some modifications to it. What follows is some brief overview skipping quite a few steps (since the purpose of this article is not to explain D3).
Important: Do not set a static width and height for your viz. It’s simple to get the width and height from the container that will hold your viz and then use this to scale your viz. The code section shown below is the essence to this:
// get width and height of container that the viz will be rendered in
// https://stackoverflow.com/questions/21990857/d3-js-how-to-get-the-computed-width-and-height-for-an-arbitrary-element
const containerWidth = d3.select(this.domContainer).node().getBoundingClientRect().width;
const containerHeight = d3.select(this.domContainer).node().getBoundingClientRect().height;

var margin = {top: 10, right: 10, bottom: 10, left: 10},
width = containerWidth - margin.left - margin.right,
height = containerHeight - margin.top - margin.bottom;
We set the Sankey diagram properties with the d3.sankey() function, which constructs a new Sankey generator with the default settings:
// Set the sankey diagram properties
var sankey =
  d3.sankey()
    .nodeWidth(36)
    .nodePadding(40)
    .size([width, height])
    .nodes(graph.nodes)
    .links(graph.links)
    ;
Next we use the sankey() funcion to compute the node and link positions for the given arguments, returning a graph representing the Sankey layout. The returned graph has the following properties:
graph.nodes: the array of nodesgraph.links: the array of links
graph = sankey();
Next we draw the links, the link titles, add the nodes and finally the titles for the nodes.
Put the CSS styles for the visualistation into css/view-d3.css:
.node rect {
  cursor: move;
  fill-opacity: .9;
  shape-rendering: crispEdges;
}

.node text {
  font-family: sans-serif;
  pointer-events: none;
  text-shadow: 0 1px 0 #fff;
}

.link {
  fill: none;
  stroke: #000;
  stroke-opacity: .2;
}

.link:hover {
  stroke-opacity: .5;
}
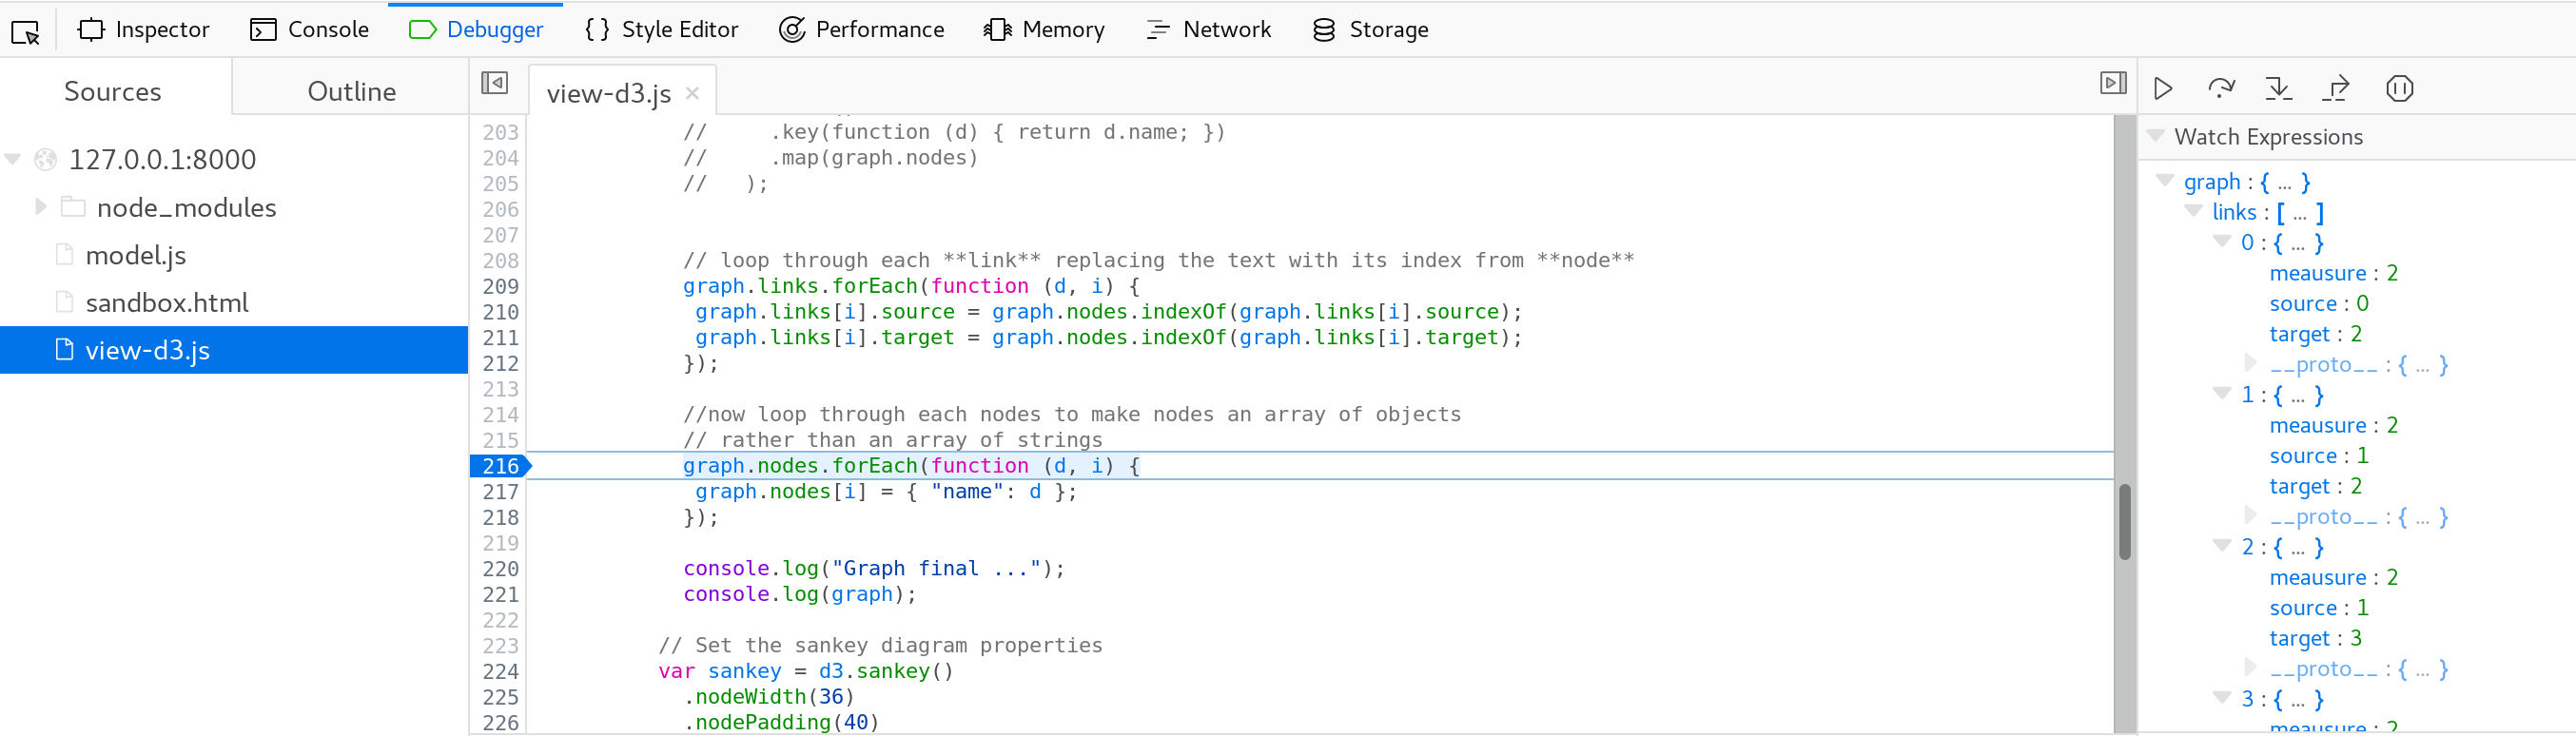
How to debug
It is advicable to use the Debugger of your web browser and set breakpoints and watch expressions (to see that value of the variables at this point) instead of using console.log. The latter did not seem to be reliable in showing the correct result.
View the Visualisation
Install npm static. This will allow you to fire up a lean webserver which uses the files in your project directory as a root:
cd <project-dir>
static -p 8000
In your favourite web browser, enter following URL:
http://localhost:8000/sandbox.html
Deployment
Creating a Configuration
Create a new file called config.js and add following content:
define(["module"], function(module) {
  // Replace /config by /model.
  // e.g. "pentaho-visual-samples-bar-d3/model".
  var vizId = module.id.replace(/(\w+)$/, "model");

  return {
    rules: [
      // Sample rule
      {
        priority: -1,
        select: {
          type: vizId,
          application: "pentaho-analyzer"
        },
        apply: {
          application: {
            keepLevelOnDrilldown: false
          }
        }
      }
    ]
  };
});
keepLevelOnDrilldown: “In Analyzer, when drilling-down, the default behaviour is to add the child field to the visual role where the parent field is. However, the Category visual role of the Bar visualization you developed only accepts a single field being mapped to it. This results in Analyzer not allowing to drill-down. However, it is possible to configure the Analyzer-specific metadata property, application.keepLevelOnDrilldown to force replacing the parent field with the child field when drilling-down.”
Register the configuration module in the sandbox. Add this to the config section of the package.json file:
"pentaho/instanceInfo": {
  "pentaho-visual-samples-sankey-d3/config": {
    "type": "pentaho.config.spec.IRuleSet"
  }
}
Building the Package
The package will only include package.json, model.js, view-d3.js, config.jsfiles and the cssfolder - any sandbox related files must not be included.
For packaging your visualization you just need to zip your files and runtime dependencies. Care must be taken not to include temporary files, dev-time dependencies, etc..
By using the npm packcommand you ensure only your files andbundled dependencies are compressed in the resulting tgz file.
# Package your files.
npm pack
Adding the Package to Analyzer, CDE and PDI
For each of these products, copy the tgz file you just built into its system/karaf/deployfolder. For more info see OSGi Artifacts Deployment if you need more information. If everything went well, you should now see your visualization as a new vis option in Analyzer and PDI. In CDE it will show up as a new component.
So for CDE deploy the compressed file to pentaho-solutions/system/karaf/deploy/.
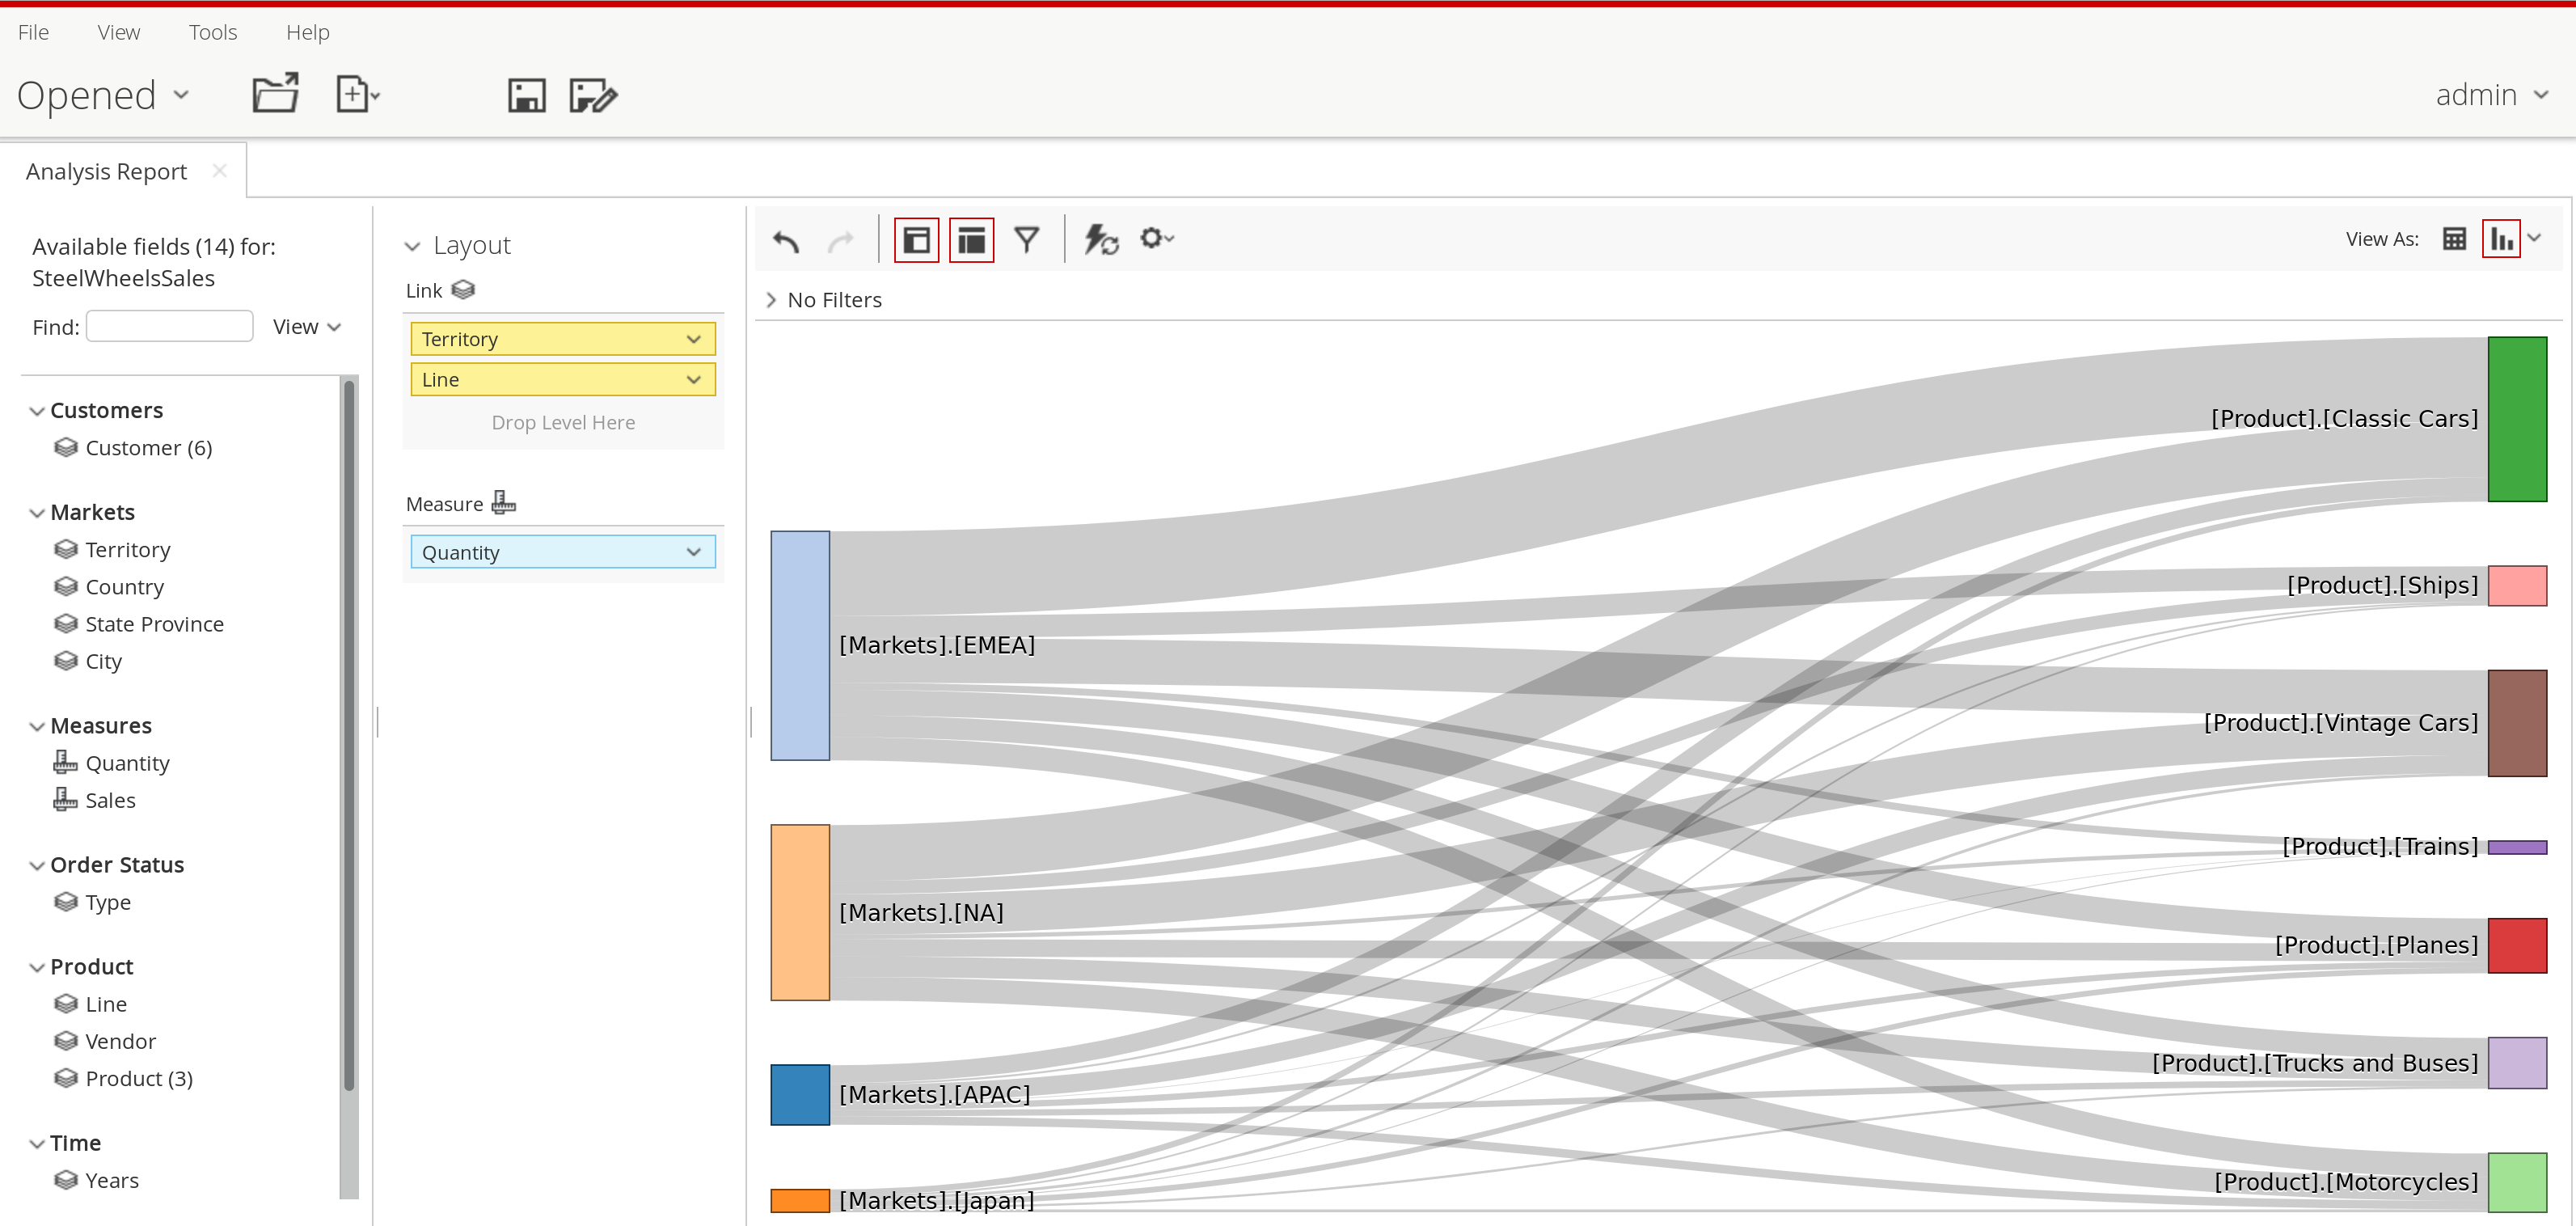
Here a screenshot of using our viz with Analyzer:
 For CDE, HV provides an example [here](https://github.com/pentaho/pentaho-engineering-samples] at the location:
Samples_for_Extending_Pentaho/javascript-apis/platform/visual-samples-bar-d3-cde
Note: If you want to explore the samples shipped with the Engineering Examples, keep in mind that the master branch is kept updated with the latest not-released version of the product, so maybe something could have changed in the meantime since the last stable version was released. You should always checkout a specific branch that corresponds to the Pentaho version you use, e.g. v8.1 (info kindly provided by Nelson Antunes):
git clone https://github.com/pentaho/pentaho-engineering-samples.git
cd pentaho-engineering-samples
git checkout 8.1
cd Samples_for_Extending_Pentaho/javascript-apis/platform/visual-samples-bar-d3
npm pack
# now you can copy the tgz file to the karaf deploy folder
cp pentaho-visual-samples-bar-d3-0.0.1.tgz ~/apps/pentaho-server-8.1/pentaho-solutions/system/karaf/deploy/
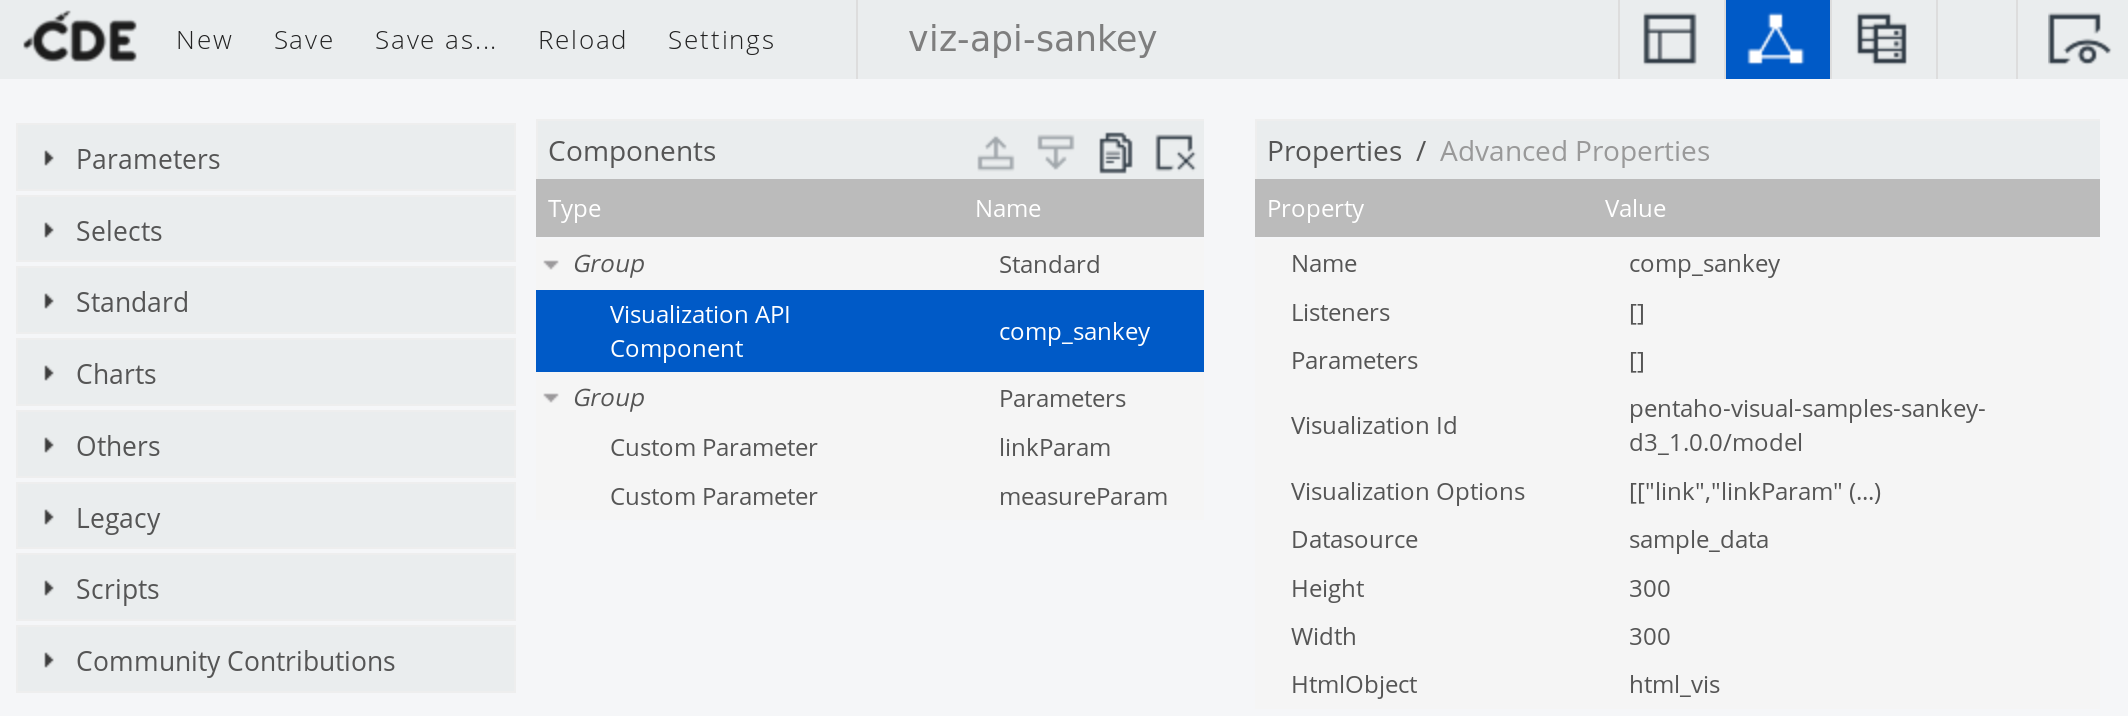
In CDE just add the Visualization API Component:
- For Visualistation ID is made up of the
nameand theversiondefined in thepackage.jsonfile, both separated by an underscore (_). This is followed by/model. In our case this ends up beingpentaho-visual-samples-sankey-d3_1.0.0/model. - For Visualization Options you kind of have to recreate to some degree the
modelSpecwe defined earlier on insandbox.html(only the role mappings, not the data). So in our case we definelinkandmeasure. We cannot directly define the fields as the value of the mapping, but have to instead create two custom parameters, which will allow us to use native JavaScript and referance these parameters in the mapping for the visulization options.
custom parameter:
- Name:
levelParam, JavaScript code:{fields: ["source", "target"]}. - Name:
measureParam, JavaScript code:{fields: ["value"]}
mapping for Visualization Options within Visualization API Component:
| Arg | Value |
|---|---|
link |
linkParam |
measure |
measureParam |
Note: Leave the parameter mapping in the Visualization API Component empty!
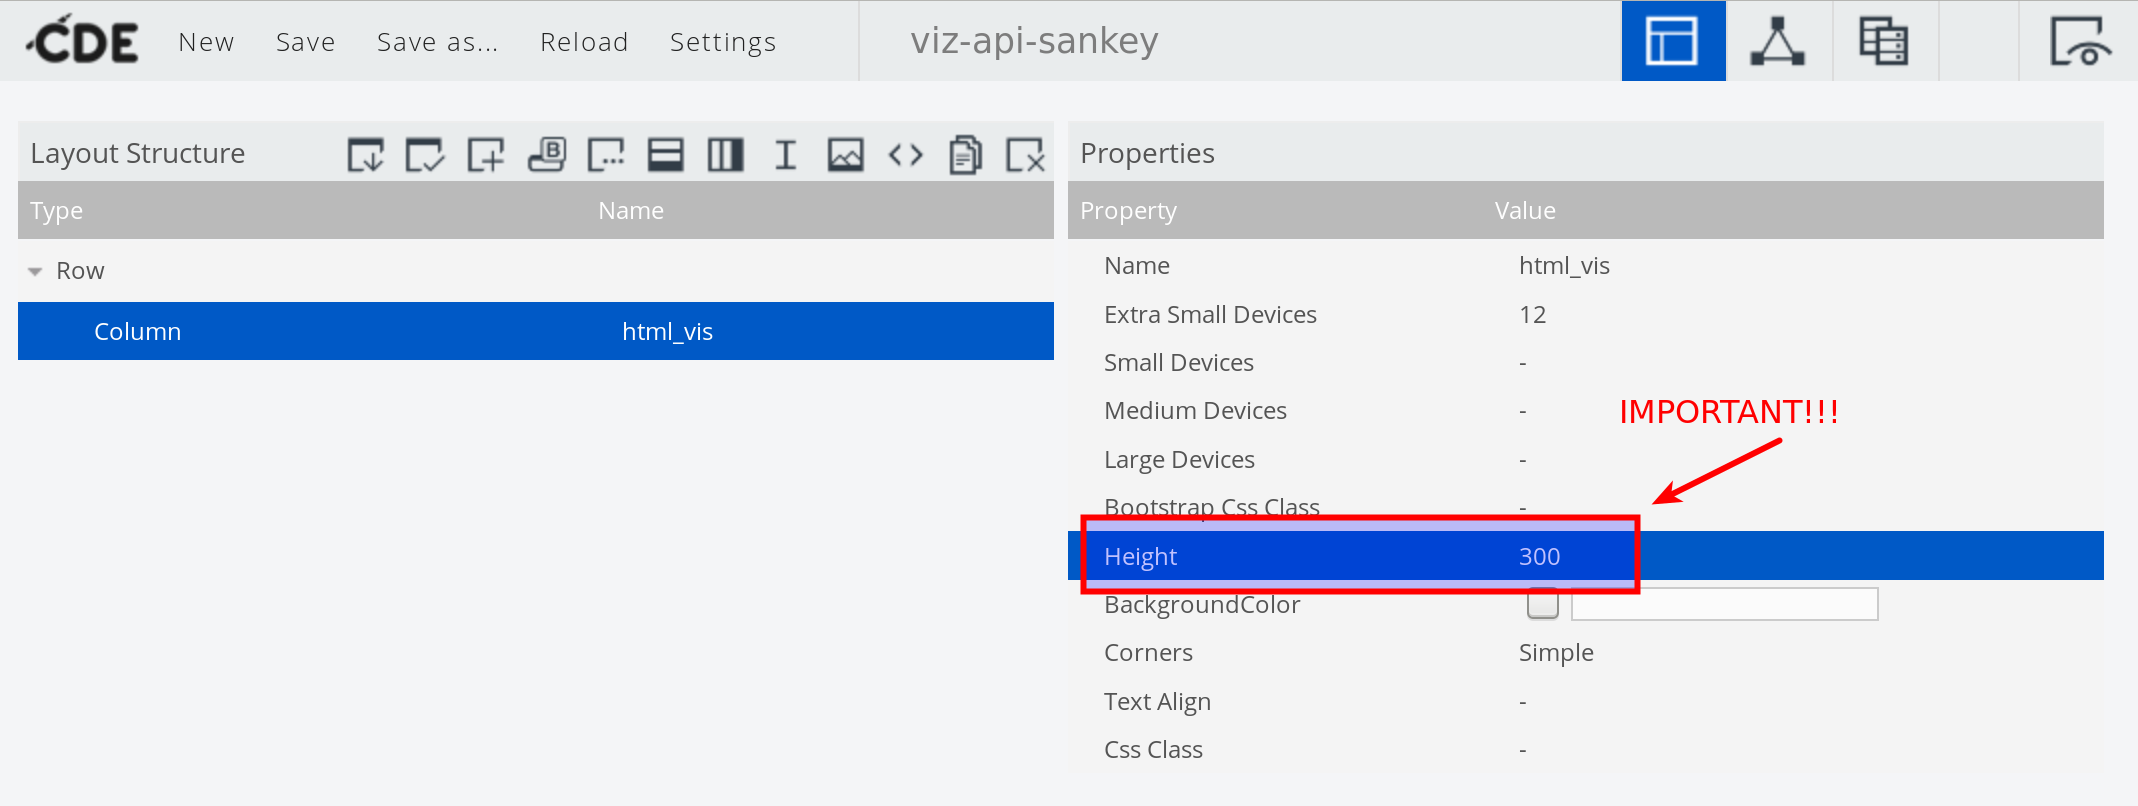
In the Layout panel you can just define a very simple structure, e.g. a row and a column.
Important: Make sure you define a height for the column otherwise your viz will not show up!
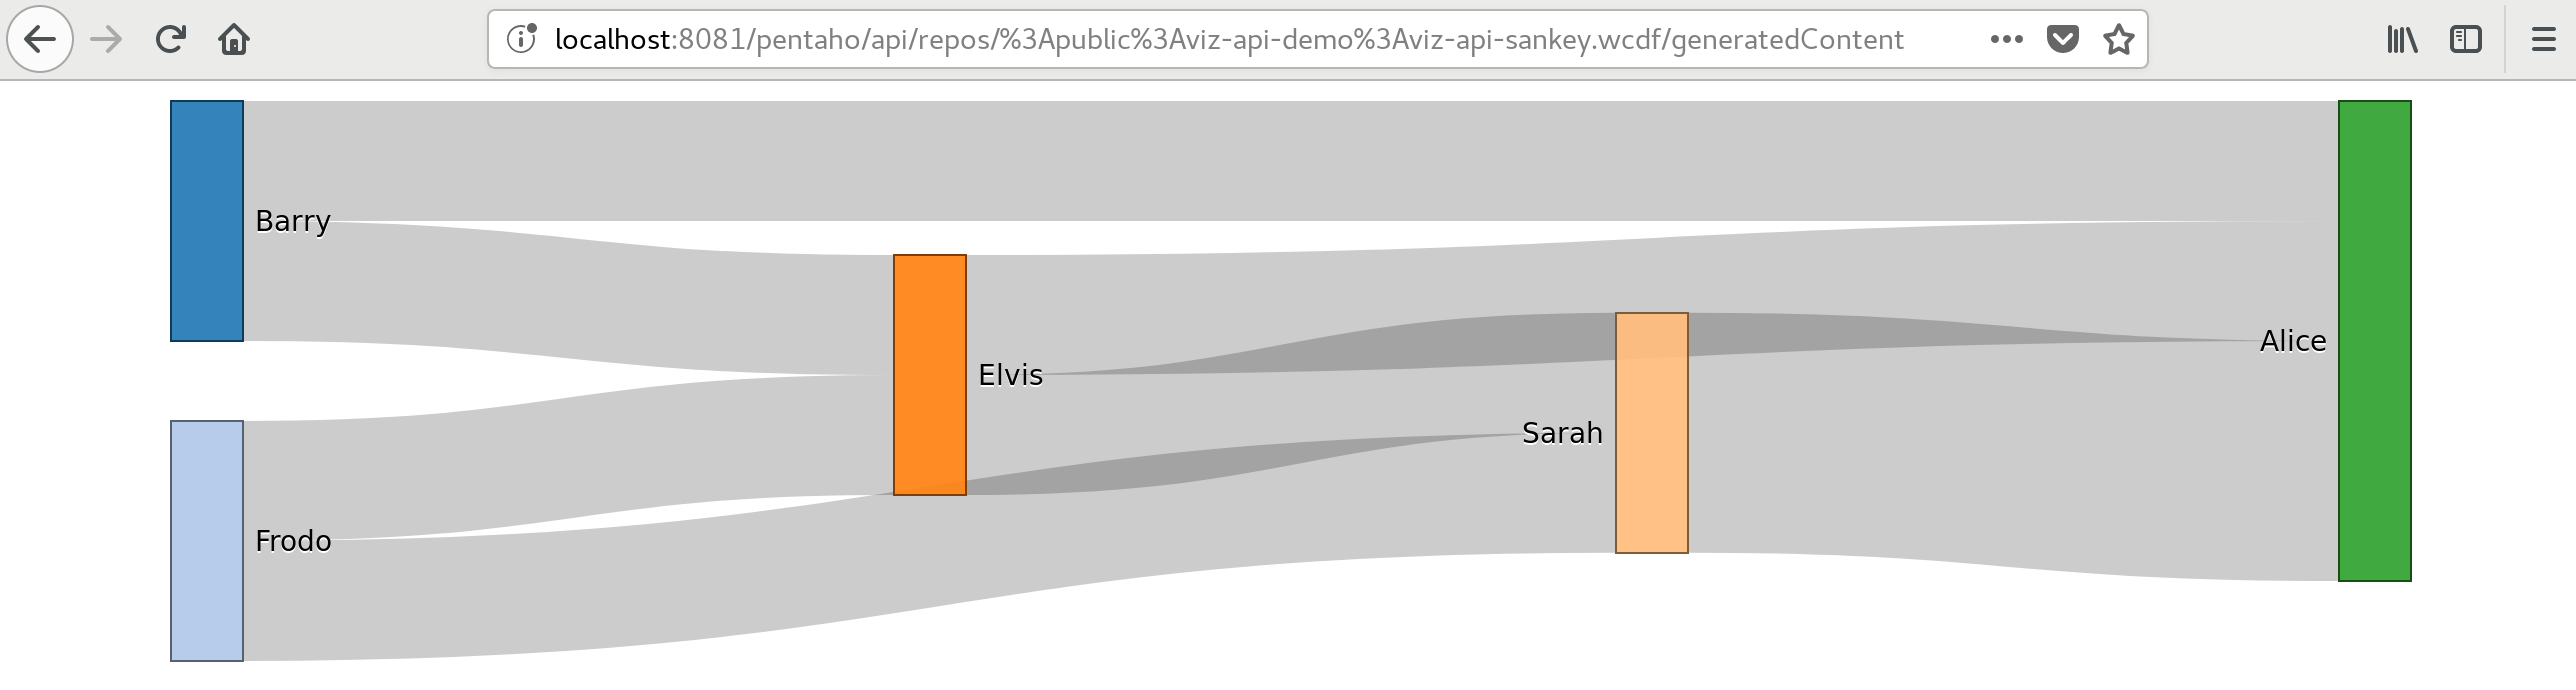
 And finally, we can preview our simple dashboard:
Conclusion
My impression so far of the Pentaho Viz API is pretty good. I really like the easy of development: You can use your standard web development tools and the tight NodeJS integration works like a charm. Having one way of creating a viz and using it in different apps has been a long term goal by Pentaho and with the Viz API it seems to finally properly materialise. I just hope that Hitachi Vantara sees the value in this tool and supports the development accordingly.
Finally, some other useful resources: