The report designer I always wanted to have?
Classic report designers like PRD and JasperReports are mostly geared towards generating long (and sometimes nested) tables. Quite often this is not required. The common use case these days is to create a dashboard and offer a PDF download as an alternative. If someone wants to export the data to Excel, you can just add an export button directly to the tables that you show in your dashboard.
One thing that I also always disliked about the classic report engines is that you have to work with sub-reports, if you want to add more than one query. This is a bit cumbersome and I might argue a bit counter-intuitive. What I’ve been saying for a few years now is that a modern reporting engine should just allow you start with a completely blank canvas and allow you to add objects (charts, tables, etc), for which you can define a data source. Simple. Pentaho CDE basically just does this, but it is mainly geared towards HTML dashboards.
In the past offering a PDF version of a CDE dashboard meant creating a separate report in PRD mostly completely from scratch. So you basically have to do the work more or less twice. This gab had to be closed! We had to find an relative easy way to generate a PDF.
Now you cannot treat the different media (print, screen) completely the same: You will always have to do some minor adjustments, especially in regards to styling. But the goal is to reuse everything else.
The styling for the dashboard is achieved using CSS. Why not use CSS for print/pdf as well? Is it possible? This is the main question that had to be answered.
Luckily, the W3C has a working draft on this subject: W3C CSS3 Paged Media. While CSS2 introduced already a few features for print (see W3C CSS2 Paged Media), the new working draft for CSS3 includes a huge bunch of features that will make CSS a serious contendor for styling print documents. We will make use of this one.
Ok, so that’s great, there is a working draft, but has anyone implemented it yet? Currently there doesn’t seem to be a browser support for it (there are some conflicting messages on the internet about it, but in a nutshell it seem like right now, there is no support). There are some commericial products available that support it partially (e.g. Prince), but this is not an option for us. All lost? No. Luckily, there is an open source tool of the name WeasyPrint available, which implements the W3C working draft. WeasyPrint is an html-to-pdf converter writting in Python, which will use the @media print rule in your CSS to style to PDF.
WeasyPrint
This open source converter supports already the W3C CSS3 Paged Media working draft!
Note: WeasyPrint doesn’t support JavaScript or
<canvas>, so you have to preprocess the files somehow to emit HTML/CSS or SVG.
Installation
Please find here the install instructions.
Mac OS X:
brew install pkg-config libffi
PKG_CONFIG_PATH=/usr/local/opt/libffi/lib/pkgconfig pip install cffi
brew install Caskroom/cask/xquartz
brew install gettext
brew install python cairo pango gdk-pixbuf libxml2 libxslt
sudo pip install WeasyPrint
weasyprint --help
Fedora:
sudo yum install gcc

sudo yum install python-devel python-pip python-lxml cairo pango gdk-pixbuf2 libffi-devel

sudo pip install WeasyPrint
weasyprint --help
To render SVG images, you will also have to install CairoSVG. On Fedora, you can install this package:
sudo yum install python-cairosvg
or:
sudo pip install cairosvg
Install instructions for other distros can be found on the CairoSVG website.
Also check the supported SVG features here. Report any SVG issues here.
You can either use the command line options to convert the HTML file to PDF or you can start a server like this:
python -m weasyprint.navigator
Open your favourite web browser and enter 127.0.0.1:5000. Enter the full path to your local html file into the input box and click on Go. Now you will see a preview. This is especially useful when developing the stylesheet!
Check out the Community Page to subscribe to the mailing list.
Installation error on Mac OS X
I got following error when installing WeasyPrint on Mac OS X:
Password:
Collecting cffi
  Using cached cffi-0.8.6.tar.gz
    Traceback (most recent call last):
      File "<string>", line 20, in <module>
      File "/tmp/pip-build-5ZCyqG/cffi/setup.py", line 85, in <module>
        use_pkg_config()
      File "/tmp/pip-build-5ZCyqG/cffi/setup.py", line 57, in use_pkg_config
        _ask_pkg_config(include_dirs,       '--cflags-only-I', '-I', sysroot=True)
      File "/tmp/pip-build-5ZCyqG/cffi/setup.py", line 20, in _ask_pkg_config
        stdout=subprocess.PIPE)
      File "/usr/local/Cellar/python/2.7.9/Frameworks/Python.framework/Versions/2.7/lib/python2.7/subprocess.py", line 710, in __init__
        errread, errwrite)
      File "/usr/local/Cellar/python/2.7.9/Frameworks/Python.framework/Versions/2.7/lib/python2.7/subprocess.py", line 1335, in _execute_child
        raise child_exception
    OSError: [Errno 20] Not a directory
    Complete output from command python setup.py egg_info:
    Traceback (most recent call last):

      File "<string>", line 20, in <module>

      File "/tmp/pip-build-5ZCyqG/cffi/setup.py", line 85, in <module>

        use_pkg_config()

      File "/tmp/pip-build-5ZCyqG/cffi/setup.py", line 57, in use_pkg_config

        _ask_pkg_config(include_dirs,       '--cflags-only-I', '-I', sysroot=True)

      File "/tmp/pip-build-5ZCyqG/cffi/setup.py", line 20, in _ask_pkg_config

        stdout=subprocess.PIPE)

      File "/usr/local/Cellar/python/2.7.9/Frameworks/Python.framework/Versions/2.7/lib/python2.7/subprocess.py", line 710, in __init__

        errread, errwrite)

      File "/usr/local/Cellar/python/2.7.9/Frameworks/Python.framework/Versions/2.7/lib/python2.7/subprocess.py", line 1335, in _execute_child

        raise child_exception

    OSError: [Errno 20] Not a directory

    Command "python setup.py egg_info" failed with error code 1 in /tmp/pip-build-5ZCyqG/cff
This seems to be realted to CFFI
To fix this, run:
brew install pkg-config libffi
PKG_CONFIG_PATH=/usr/local/opt/libffi/lib/pkgconfig pip install cffi
as outlined here.
Limitations
While WeayPrint implements a lot of CSS features, not everythig that you can do in a standard web browser is available. Read this and this to understand, which CSS features are not supported.
The input HTML has to be preprocessed. This can be easily worked around by using PhantomJS or similar.
Another smaller drawback is that inline SVG rendering is currently not supported. This is not a big problem as long as you get the prerendered SVG via CGG from CCC e.g.
In a nutshull: There is no real show stopper!
Using CSS for Print - Lessons Learnt
First it is very important to understand the page model:

Understanding Page Margin Boxes is elementary for creating headers and footers:

You do not have to define all the page margin boxes. If you do not define one of the margin boxes, the one left to it can consume all of its space - this can easily be achieved by setting the width to 100%.
Keep in mind that width can be specified in cm or percentage. Do not use px or em. Using percentage is probably the easiest approach, as it is unlikely that margin boxes will overlap.
Note that @top-left, @top-center and @top-right share the same space, so if you define in example on @top-left and @top-right, you could set the width of the first one to 70% and the other one to 30%.
Note that you do not have to define a width or height for the the corners, as they are defined by the page margins!
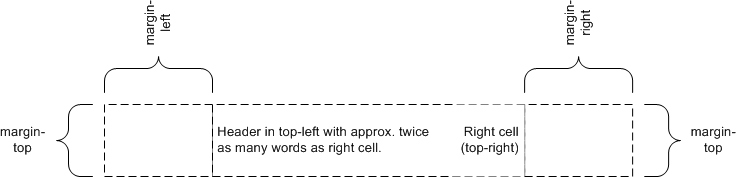
Also keep in mind that any padding adds to the size of the page margin box.
Another advice (Source):
“Print measurements include points, picas, inches, centimeters, and millimeters. Don’t use any measurements that are relative to the screen resolution (pixels) or the parent elements (em and ex) or relative to the surrounding text or default browser size (percentages and xx-small/xx-large respectively).”
Practical example
What follows is a brief walkthrough of my very basic workflow:
Design your report
This should be fairly straight forward: Nothing new to learn! Everything is based on standards like HTML, CSS, JavaScript and SVG. You do not have to use any new and dedicated report designer! Just use your favourite editor and that’s it! Switch on the web preview option in your editor and you have a super fast working environment!
You only have to apply some common sense principles of what will not work in print (as opposed to the web): There is no interaction, etc.
We will get all our data from the Pentaho BA-Server using CDA (Community Data Access). You can use their charting library as well (CCC, short for Community Charts Component), ideally via CGG (Community Graphics Generator). This option will output SVG directly, which we can use on our report: See this blogpost on how to do this. Alternatively you can also use D3js for charting.
The most important bit is of course the CSS. Let’s have a quick look at this:
Let’s set up first the page and define the header and footer. We also add a page counter to the header:
@page {

	size: A4 portrait;
	margin: 1.5cm 1.5cm 1.5cm 1.5cm;

	@top-left-corner {
		content: ""; /* has to be specified! */
		background-color: rgba(42, 201, 80, 0.220);
		border-bottom: solid green;
	}

	@top-left {
		width: 70%;
		content: "";
		background: url('images/logo_v4.png'), rgba(42, 201, 80, 0.220);
		background-repeat: no-repeat, repeat;
		background-position: left center, left;
		background-size: contain; /* 5cm, cover or 100%: scale bg image, retains img ratio */
		border-bottom: solid green;
	}

	@top-right {
		width: 30%;
		content: "Page " counter(page) " of " counter(pages);
		vertical-align: middle;
		font-family: sans-serif;
		font-weight: bold;
		font-size: 0.7cm;
		color: white;
		text-align: center;
		background-color: #53c963;
		border-bottom: solid green;
		}

	@top-right-corner {
		content: " ";
		background-color: rgba(42, 201, 80, 0.220);
		/* background-color: #79caff; */
		border-bottom: solid green;
	}

	@bottom-center {
		width: 100%;
		content: "Reporting Powered by Open Source Software";
		vertical-align: middle;
		font-family: sans-serif;
		font-weight: bold;
		font-size: 0.7cm;
		color: green;
	}

}
Next we define a rule, which applies the styles to all output types:
@media all {

	.section-title {
		color: black;
		font-weight: bold;
		text-align: left;
		clear: both;
	}

	.box-container-title {
		width: 100%;
		background: rgba(255, 127, 42, 0.75);
		color: white;
		font-weight: bold;
		text-align: left;
	}

	.container-title {
		width: 100%;
		height: 100%;
		vertical-align: middle;
	}

	...
}
Note: In the all rule I didn’t mention any properties that require an exact measure, e.g. px, em, cm, mm etc. We will define the styles again in the output specific rules (print, screen, etc) and add these properties there. For print we will use
mmandcm, whereas for screenpxandem.
Next we define a rule for print:
@media print {
  html, body {
		font-family: sans-serif;
		background: none;
		color: black;
	}
	.section-title {
		font-size: 0.7cm;
		padding-top: 0.17cm;
		margin-top: 0.5cm;
		margin-bottom: 0.2cm;
	}

	.box-container-title {
		height: 0.6cm;
		font-size: 0.5cm;
		padding-bottom: 0.12cm;
		margin-bottom: 0.2cm;
	}
	.container-title {
		padding-top: 0.17cm;
		padding-left: 0.2cm;
	}
	...
}
And finally we create a rule for output type screen:
@media screen {
	html, body {
		font-family: sans-serif;
		background: none;
		color: black;
	}

	.section-title {
		font-size: 1em;
		text-align: left;
		padding-top: 0.1em;
		margin-top: 0.3em;
		margin-bottom: 0.3em;
	}

	.box-container-title {
		height: 20px;
		background: rgba(255, 127, 42, 0.75);
		font-size: 0.9em;
		margin-bottom: 0.2em;
		font-size: 0.9em;
		margin-bottom: 0.2em;
	}
	.container-title {
		padding-top: 0.1em;
		padding-left: 0.2em;
	}
	...
}
If you are a bit familiar with CSS, this is fairly straight forward to set up.
Now let’s briefly talk about the common report elements: charts and tables.
Charts can be easily added to your HTML file like this:
<img src="http://localhost:8080/pentaho/plugin/cgg/api/services/draw?script=/public/Dashboards/Report/Quarterly-Report_comp_chart_consumption.js&outputType=svg&userid=admin&password=password">
Well, certainly this approach is not meant for production environments (you do not want to make the username and password visible like this!) - this is just for dev/testing in your local editor - you can later on remove the authentication details. All the above does is source a Pentaho CCC chart, which was created in CDE, via CGG.
In regards to creating tables, you can just use d3js therefor and source the data from CDA.
Preprocessing the HTML server side
Our report (consisting of HTML, JavaScript and CSS files) includes various dynamic elements. WeasyPrint cannot handle input this way … we have to preprocess these files to get to final HTML output.
PhantomJS to the rescue
As previously stated, WeasyPrint cannot handle JavaScript. The solution is to preprocess it server side using PhantomJS.
Note: Certainly you could make use of the classic server side scripting languages like JSP, ASP etc. But I’d argue that the traditional dashboard designer is more familiar with client side scripting and the approach outlined here doesn’t really introduce a lot of new learning requirements.
Installation instructions can be found here. If you are using Mac OS X and Homebrew, you can just install it like this:
brew install phantomjs
Once installed just write this simple JavaScript:
var fs = require('fs');
var page = require('webpage').create();
var url = 'file://' + fs.absolute('./sample1.html');

page.open(url, function (status) {
  if(status === "success") {
	  console.log(page.content);
  }
 	phantom.exit();
});
Then execute on the command line:
phantomjs generator.js > output.html
And your sample1.html page will be rendered and the output saved to a dedicated file. So if you used D3js in sample1.html to dynamically render a table, the output file will have the full table HTML in it.
Some info was sourced from this blog post
Preview the print output using weasyprint.navigator
Now that we have the preprocessed HTML output, let’s preview the print output using the handy weasyprint.navigator server.
python -m weasyprint.navigator
Open your favourite web browser and enter 127.0.0.1:5000.
Paste the full filepath to output.html into the input field and click Go. If you are happy with the preview, you can also download the pdf by clicking on the PDF link.
Other Notes
Preprocessing
NodeJS: JSDOM
Another option to preprocess the HTML is via NodeJS and JSDOM:
Install jsdom like this:
npm install jsdom
Finally execute:
node index.js > result.svg
D3JS or CCC
If you decide not to use Pentaho CDE for creating the charts and prefer coding the charts (d3js or CCC) directly in your HTML or separate JavaScript file, make sure you preprocess everything before handing it over to WeasyPrint. NodeJS should offer you enough tools to do this. Currently WeasyPrint does not have support for inline SVG.
Thougths
In theory you could process everything on the server side using NodeJS and use WebSocket or socket.io (the later one will support both WebSocket where available and provide Polyfills otherwise) to “transport” the PDF to the client.
Here some interesting, related blog posts:
- Pre-render d3.js charts at server side
- Render SVG Charts Server-side With D3.js Related Code
- Love Generating SVG With JavaScript? Move It To The Server!
- pdfkit for nodejs
- Set up a REST service for PDF generation
- NodeJS Phantom
My example
I put together a very basic example of using CSS for creating PDF reports. The code can be found here on Github.
Conclusion
CSS3 for paged media is a very promising standard, which will be hopefully implemented be more open source/free solutions in the future. Currently WeasyPrint seems to be the only open source tool available and it allows us to freely explore the new CSS3 features. It is very handy that it comes with a demo server to quickly preview the PDF output.
Is WeasyPrint a viable additation to the Pentaho BA Server environment? This has to be very wisely thought about: WeasyPrint is writting in Python and this fact doesn’t naturally make it fit into the Java world Pentaho relies on. There could be ways to integrate it, so that easy solutions are possible, but someone would first have to build this bridge. In general it would be great if there was an open source tool based on Java or JavaScript around, which could be easily integrated - however, there isn’t one right now. Another hope is that in future web browsers will natively support the CSS3 for paged media specification/recommendation. This would certainly be the best case scenario. I am hoping for the latter on to happen.
Sources
- 6 Things I Learned About Print Stylesheets From HTML5 Boilerplate
- Create a Customized Print Stylesheet in Minutes
- CSS-Tricks Finally Gets A Print Stylesheet
- Print stylesheet - the definitive guide
- Footer
- CSS to set A4 paper size
- CSS Paged Media - @page Rule
- Tips And Tricks For Print Style Sheets
- W3C CSS2 Paged Media
- W3C CSS3 Paged Media: Best source! Interesting also the tests carried out for each spec.
- W3C CSS Generated Content for Paged Media Module
- Building Books with CSS3 Extremely informative!
- There is NO browser support for paged media currently.
- Designing For Print With CSS
Open Source HTML to PDF converters
- XHTML2PDF Github
- Apparently a better tool is: wkhtmltopdf