Often charts just show quantitative data, but what if you could enrich your chart by showing related information, like in example events happening at the same time?
Some time ago Pentaho published their Fine Art of Business Intelligence dashboard showcase. Among the sample dashboards there was one particular chart, which I thought was very interesting: A line chart showing related campaign information. It looked really cool … so certainly I wanted to know how this one was created. I set out on a journey to find out the secret. I was first under the impression that this chart was created using the CCC, but a bit later I discovered that this use case is not really covered by CCC. As protovis, the charting framework which CCC is based on, is no longer in active developement and the d3js the official successor, in the end I set out to solve this challenge with this charting framework.
But upfront I share some interesting things I learnt about showing events in CCC:
Show daily events
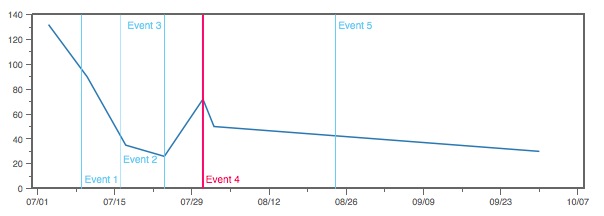
If you would like to add daily event information to your charts, the CCC provides a convient markEvent method.
Note: As mentioned, this works for one day events only (and cannot be used for events that last several days).
The markEvent function accepts three arguements and is meant to enrich timeseries charts with additional event information:
markEvent(date, label, options);
The CCC Exmaples provide us with a detailed explanation of these arguments:
- date: A string matching the supplied format
- label: The description to be used
- options (optional): options (optional) - Options to be passed to the event renderer, overriding the default behavior
You can override following options:
| Property | Default Value | Description |
|---|---|---|
| strokeStyle | “#5BCBF5” | Line Color |
| lineWidth | “0.5” | Line Width |
| textStyle | “#5BCBF5” | Text Color |
| verticalOffset | 10 | Distance between vertical anchor and label |
| verticalAnchor | “bottom” | Vertical anchor: top or bottom |
| horizontalAnchor | “right” | Horizontal anchor: left or right |
| forceHorizontalAnchor | false | Horizontal anchor position will be respected if true |
| horizontalAnchorSwapLimit | 80 | Horizontal anchor will switch if less than this space available |
Example:
var ds_relational = {
    "resultset": [
        ["2011-07-03", 72],
        ["2011-07-10", 50],
        ["2011-07-17", 20],
        ["2011-07-24", 23],
        ["2011-07-31", 72],
        ["2011-08-02", 50],
        ["2011-07-03", 60],
        ["2011-07-10", 40],
        ["2011-07-17", 15],
        ["2011-07-24", 3 ],
        ["2011-09-30", 30]
    ],
    "metadata": [{
        "colIndex": 0,
        "colType": "String",
        "colName": "Date"
    }, {
        "colIndex": 2,
        "colType": "Numeric",
        "colName": "Value"
    }]
};

new pvc.LineChart({
    canvas: "cccExample",
    width:   600,
    height:  200,
    animate: false,
    timeSeries: true,
    timeSeriesFormat: "%Y-%m-%d",
    renderCallback: function(){
        this.chart
            .markEvent("2011-07-09", "Event 1")
            .markEvent("2011-07-16", "Event 2",
                {verticalOffset: 30})
            .markEvent("2011-07-24", "Event 3",
                {verticalAnchor: "top", horizontalAnchor: "left"})
            .markEvent("2011-07-31", "Event 4",
                {verticalAnchor: "bottom", forceHorizontalAnchor: false,
                strokeStyle: "#FF0066", lineWidth: "2", textStyle: "#FF0066"})
            .markEvent("2011-08-24", "Event 5",
                {verticalAnchor: "top"})
            ;
        }
        })
        .setData(ds_relational, {crosstabMode: false})
.render();
Pro Tip: If you want a quick way to try this out with hardly any setup required (no Pentaho BA-Server etc), just create a simple HTML file like the one shown below:
<html>
    <head>
        <!-- Java Script Resources -->
        <script src="https://code.jquery.com/jquery-2.1.1.js" type="text/javascript"></script>
        <script src="http://www.webdetails.pt/ctools/charts/lib/jquery.tipsy.js" type="text/javascript"></script>
        <script src="http://www.webdetails.pt/ctools/charts/lib/protovis.js" type="text/javascript"></script>
        <script src="http://www.webdetails.pt/ctools/charts/lib/protovis-msie.js" type="text/javascript"></script>
        <script src="http://www.webdetails.pt/ctools/charts/lib/tipsy.js" type="text/javascript"></script>
        <script src="http://www.webdetails.pt/ctools/charts/lib/def.js" type="text/javascript"></script>
        <script src="http://www.webdetails.pt/ctools/charts/lib/pvc-r2.0.js" type="text/javascript"></script>

        <!-- Sample Data -->
        <script src="http://www.webdetails.pt/ctools/charts/lib/q01-01.js" type="text/javascript"></script>
        <script src="http://www.webdetails.pt/ctools/charts/lib/bp.js" type="text/javascript"></script>

        <!-- Stylesheet -->
        <link rel="stylesheet" href="http://www.webdetails.pt/ctools/charts/lib/tipsy.css" type="text/css" />
    </head>
    <body>
        <div id="cccExample"/>
        <script type="text/javascript">
        <!-- Add your CCC code -->
        <!-- use e.g. the first code snippet shown in this ection -->
        </script>
    </body>
</html>
Let’s make this a bit more interesting: Certainly we do not want to specify the events manually. Let’s make this dynamic: We have to adjust the code just a little bit and add an additional dataset:
var ds_events = {
    "resultset": [
        ["2011-07-09", "Event 1"],
        ["2011-07-16", "Event 2"],
        ["2011-07-24", "Event 3"],
        ["2011-07-31", "Event 4"],
        ["2011-08-24", "Event 5"],
    ],
        "metadata": [{
        "colIndex": 0,
        "colType": "String",
        "colName": "Date"
    }, {
        "colIndex": 2,
        "colType": "String",
        "colName": "Event"
    }]
};

new pvc.LineChart({
    canvas: "cccExample",
    width:   600,
    height:  200,
    animate: false,
    timeSeries: true,
    timeSeriesFormat: "%Y-%m-%d",
    renderCallback: function(){
        for(i=0;i<ds_events.resultset.length;i++){
            this.chart.markEvent(ds_events.resultset[i][0],ds_events.resultset[i][1]);
            }
        }
    })
    .setData(ds_relational, {crosstabMode: false})
    .render();
This is a very simple approach: You could as well add the formatting information to the event dataset and read it in … but I’ll leave this up to you.
And the credits go to …
Many thanks to Duarte Cunha Leão from the Pentaho Webdetails team for providing information on CCC markEvent!
Show event periods
In this example we will try to show information for charts that lasted for a specific period. There are various approaches to solving this:
- ranges: We could highlight ranges in the chart area. This works fine as long as there are not too many overlapping events. The other disadvantage of this approach is that the classic ranges usually do not allow us to show an event name.
- upside-down bar chart: A trick would be to use a bar chart. Strickly speaking our events do not have any quantitative data, but we can just make up the bar height. This approach also allows us to show labels.
- (grid) lines
- our custome solution
Let’s list our requirements for the event highlight:
- draw a vertical dashed line for the start as well as one for the end of the event. We draw this line from the top of the chart to the bottom, making sure it reaches below the x-axis.
- draw a horizontal line which connects the bottom endpoints of the vertical lines.
- Add a label below the vertical line
First let’s investigate if we can draw dashed lines in CCC (which is not a standard Protovis feature).
Dashed lines
Dashed lines are implemented via the strokeDasharray property. This can be called on various charts using a chart specific prefix, in example for line charts it can be specified like this:
line_strokeDasharray: '- ',
line_strokeStyle: 'red'
For extension points you can specify them as shown in the code snippet below:
extensionPoints: {
	plot_add: function() {
        return new pv.Rule()
            .visible(function() {
                var orthoAxis = this.getContext().chart.axes.ortho;
                return !orthoAxis.scale.isNull;
            })
            .bottom(function() {
                var orthoAxis = this.getContext().chart.axes.ortho;
                // Domain before tick rounding
                var origDomain = orthoAxis.domain;
                return orthoAxis.scale(origDomain[1]);
            })
            .height(null)
            .left(0)
            .right(0)
            .strokeDasharray('- ')
            .strokeStyle('red');
    }
}
While we can draw dashed lines in CCC, our other requirements do not seem to be covered.
Showing Events with D3js
D3js is the successor to Protovis and has been around for some years now. D3js provides a lot of features, indeed, there is a lot to like about it! Ok, let’s start off with a basic line chart. There are many examples around: You can use this one as a starting point (I use a slightly modified version of it). I will not go into any details on how to create a line chart with d3js (because there are already some very good tutorials around of this topic), but instead focus on adding the event information to the chart.
Our initial line chart is based on this code:
<!DOCTYPE html>
<meta charset="utf-8">
<style>

.bar {
    fill: none;
    stroke-width:1;
    stroke:rgb(0,0,0);
    stroke-opacity: 0.4;
    stroke-dasharray: 5, 3, 9, 2;
}

.bar:hover {
  fill: brown;
}

.axis {
  font: 10px sans-serif;
}

.axis path,
.axis line {
  fill: none;
  stroke: #000;
  shape-rendering: crispEdges;
}

.x.axis path {
  display: none;
}

</style>
<body>
<script src="http://d3js.org/d3.v3.min.js"></script>
<script>

var data = [
	{"date":"Midnight","sales":18},
	{"date":1,"sales":32},
	{"date":2,"sales":17},
	{"date":3,"sales":3},
	{"date":4,"sales":2},
	{"date":5,"sales":7},
	{"date":6,"sales":13},
	{"date":7,"sales":41},
	{"date":8,"sales":89},
	{"date":9,"sales":76},
	{"date":10,"sales":59},
	{"date":11,"sales":43},
	{"date":"Noon","sales":68},
	{"date":13,"sales":69},
	{"date":14,"sales":75},
	{"date":15,"sales":72},
	{"date":16,"sales":83},
	{"date":17,"sales":81},
	{"date":18,"sales":108},
	{"date":19,"sales":60},
	{"date":20,"sales":38},
	{"date":21,"sales":41},
	{"date":22,"sales":37},
	{"date":23,"sales":39}
	];

var margin = {top: 20, right: 20, bottom: 40, left: 40},
    width = 960 - margin.left - margin.right,
    height = 500 - margin.top - margin.bottom;

var x = d3.scale.ordinal()
    .rangeRoundBands([0, width], .1);

var y = d3.scale.linear()
    .range([height, 0]);

var xAxis = d3.svg.axis()
    .scale(x)
    .orient("bottom");

var yAxis = d3.svg.axis()
    .scale(y)
    .orient("left")
    //.ticks(10, "%");
    .ticks(10)
var svg = d3.select("body").append("svg")
    .attr("width", width + margin.left + margin.right)
    .attr("height", height + margin.top + margin.bottom)
    .append("g")
    .attr("transform", "translate(" + margin.left + "," + margin.top + ")");

x.domain(data.map(function(d) { return d.date; }));
y.domain([0, d3.max(data, function(d) { return d.sales; })]);

svg.append("g")
  .attr("class", "x axis")
  .attr("transform", "translate(0," + height + ")")
  .call(xAxis);

svg.append("g")
  .attr("class", "y axis")
  .call(yAxis)
.append("text")
  .attr("transform", "rotate(-90)")
  .attr("y", 6)
  .attr("dy", ".71em")
  .style("text-anchor", "end")
  .text("Sales");

svg.selectAll(".bar")
  .data(data)
.enter().append("bar")
  .attr("class", "bar")
  .attr("x", function(d) { return x(d.date); })
  .attr("width", x.rangeBand())
  .attr("y", function(d) { return y(d.sales); })
  .attr("height", function(d) { return height - y(d.sales); });

function type(d) {
  d.sales = +d.sales;
  return d;
}

</script>
Let’s keep it simple first and add just one static event. There are following tasks:
- Draw a horizontal dashed line for the start and end of the event
- Draw one vertical solid line on the bottom which connects the start and end dates
- Add a text element which holds the event name
Most of the styling requirements can be implemented by using CSS:
.eventlineborder {
    stroke-width:1;
    stroke: #289615;
    stroke-dasharray: 5, 3, 9, 2;
}

.eventlineconnector {
    stroke-width:1;
    stroke: #289615;
}

.eventtitle {
    font-family: Verdana;
    font-size: 10px;
    letter-spacing: 2px;
    stroke: #289615;
    text-anchor: middle;
}
And now let’s add the specific d3 JavaScript code:
// draw a line: end event
svg.append("line")
    .attr("x1", 150)
    .attr("y1", 0)
    .attr("x2", 150)
    .attr("y2", 465)
    .attr("class","eventlineborder");

// draw a line: period connector event
svg.append("line")
    .attr("x1", 50)
    .attr("y1", 465)
    .attr("x2", 150)
    .attr("y2", 465)
    .attr("class","eventlineconnector");

// add event label
svg.append("text")
      .attr("x", 50 + ((150 - 50)/2))
      .attr("y", 478)
      .attr("class", "eventtitle")
      .text("Summer Event");
That’s actually quite straight forward and the result looks like this:
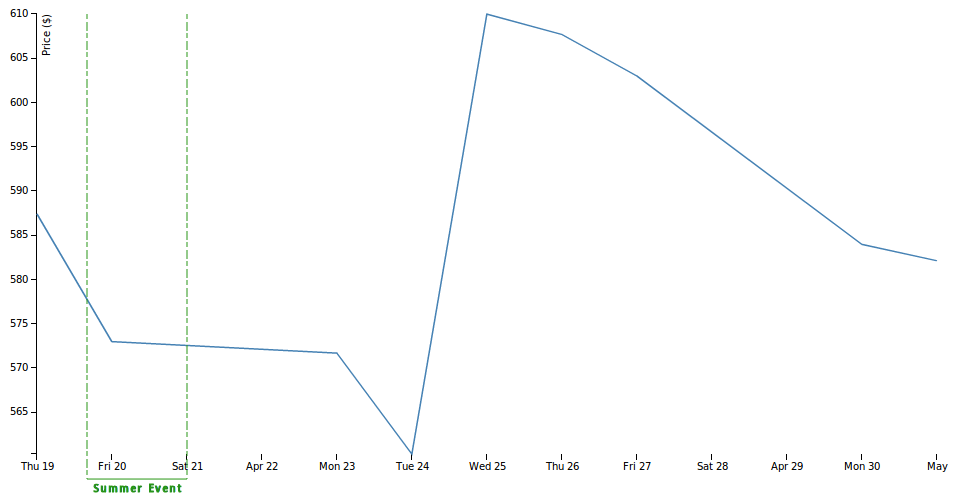
Let’s improve this a bit by moving the essential data points start and end date to dedicated variables. Also, we will define the horizontal line length based on the chart height and add a few pixels so that it reaches below the x-axes. And finally we put everything into an SVG g (short for group) element so that we can treat all the elements as one.
var eventPeriod = svg.append("g"),
  eventHeight = height + 25,
  eventStart = 50,
  eventEnd = 150
;

// draw a line: start event

eventPeriod.append("line")
  .attr("x1", eventStart)
  .attr("y1", 0)
  .attr("x2", eventStart)
  .attr("y2", eventHeight)
  .attr("class","eventlineborder");

// draw a line: end event
eventPeriod.append("line")
  .attr("x1", eventEnd)
  .attr("y1", 0)
  .attr("x2", eventEnd)
  .attr("y2", eventHeight)
  .attr("class","eventlineborder");

// draw a line: period connector event
eventPeriod.append("line")
  .attr("x1", eventStart)
  .attr("y1", eventHeight)
  .attr("x2", eventEnd)
  .attr("y2", eventHeight)
  .attr("class","eventlineconnector");

// add event label
eventPeriod.append("text")
    .attr("x", eventStart + ((eventEnd - eventStart)/2))
    .attr("y", eventHeight + 12)
    .attr("class", "eventtitle")
    .text("Summer Event");
Currently we are not using a real date to define the start and end points for the event indicator, just pixel locations. So let’s change this:
var eventPeriod = svg.append("g"),
  eventHeight = height + 25,
  eventStart = x(parseDate("20-Apr-12")),
  eventEnd = x(parseDate("24-Apr-12"))
;
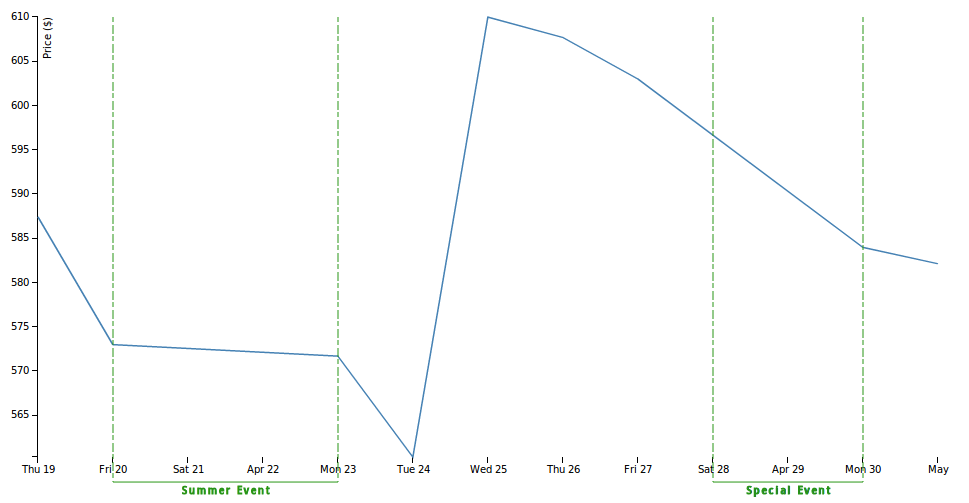
Note we are using the custom x() function to scale the data accordingly. Let’s make this more dynamic by introducing an event dataset and improving the drawing code:
var eventData = [
{"name": "Summer Event", "startdate": "20-Apr-12",  "enddate": "23-Apr-12"},
{"name": "Special Event", "startdate": "28-Apr-12",  "enddate": "30-Apr-12"}
];

// convert to proper JS date format
eventData.forEach(function(d) {
  d.startdate = parseDate(d.startdate);
  d.enddate = parseDate(d.enddate);
});


var eventHeight = height + 25;

var eventInd = svg.selectAll(".eventInd")
  .data(eventData)
  .enter()
  .append("g")
  .attr("class", "eventInd")
;

eventInd.append("line")
  .attr("x1", function(d) { return x(d.startdate); })
  .attr("y1", 0)
  .attr("x2", function(d) { return x(d.startdate); })
  .attr("y2", eventHeight)
  .attr("class","eventlineborder")
;

// draw a line: end event
eventInd.append("line")
  .attr("x1", function(d) { return x(d.enddate); })
  .attr("y1", 0)
  .attr("x2", function(d) { return x(d.enddate); })
  .attr("y2", eventHeight)
  .attr("class","eventlineborder")
;

// draw a line: period connector event
eventInd.append("line")
  .attr("x1", function(d) { return x(d.startdate); })
  .attr("y1", eventHeight)
  .attr("x2", function(d) { return x(d.enddate); })
  .attr("y2", eventHeight)
  .attr("class","eventlineconnector")
;

// add event label
eventInd.append("text")
  .attr("x", function(d) { return x(d.startdate) + ((x(d.enddate) - x(d.startdate))/2); })
  .attr("y", eventHeight + 12)
  .attr("class", "eventtitle")
  .text(function(d) { return d.name; })
;
Our chart looks like this now:
Our current setup works fine as long as no events are overlapping. Let’s make this a bit more flexible by introducing different colors for each event and also varying the height of the horizontal lines. We also add some more margin at the bottom to have more space for the event labels. Here is the complete code (also available as gist):
<!DOCTYPE html>
<meta charset="utf-8">
<style>

body {
  font: 10px sans-serif;
}

.axis path,
.axis line {
  fill: none;
  stroke: #000;
  shape-rendering: crispEdges;
}

.x.axis path {
  display: none;
}

.line {
  fill: none;
  stroke: steelblue;
  stroke-width: 1.5px;
}

.eventlineborder {
    stroke-width:1;
    stroke-dasharray: 5, 3, 9, 2;
}

.eventlineconnector {
    stroke-width:1;
}

.eventtitle {
    font-family: Verdana;
    font-size: 10px;
    letter-spacing: 2px;
    text-anchor: middle;

</style>
<body>
<script src="http://d3js.org/d3.v3.js"></script>
<script>

var data = [
{"date": "1-May-12",  "close": 582.13},
{"date": "30-Apr-12",  "close": 583.98},
{"date": "27-Apr-12",  "close": 603.00},
{"date": "26-Apr-12",  "close": 607.70},
{"date": "25-Apr-12",  "close": 610.00},
{"date": "24-Apr-12",  "close": 560.28},
{"date": "23-Apr-12",  "close": 571.70},
{"date": "20-Apr-12",  "close": 572.98},
{"date": "19-Apr-12",  "close": 587.44}
];

var margin = {top: 20, right: 20, bottom: 70, left: 40},
    width = 960 - margin.left - margin.right,
    height = 500 - margin.top - margin.bottom;

var parseDate = d3.time.format("%d-%b-%y").parse;

var x = d3.time.scale()
    .range([0, width]);

var y = d3.scale.linear()
    .range([height, 0]);

var xAxis = d3.svg.axis()
    .scale(x)
    .orient("bottom");

var yAxis = d3.svg.axis()
    .scale(y)
    .orient("left");

var line = d3.svg.line()
    .x(function(d) { return x(d.date); })
    .y(function(d) { return y(d.close); });

var svg = d3.select("body").append("svg")
    .attr("width", width + margin.left + margin.right)
    .attr("height", height + margin.top + margin.bottom)
  .append("g")
    .attr("transform", "translate(" + margin.left + "," + margin.top + ")");


data.forEach(function(d) {
  d.date = parseDate(d.date);
  d.close = +d.close;
});

x.domain(d3.extent(data, function(d) { return d.date; }));
y.domain(d3.extent(data, function(d) { return d.close; }));

svg.append("g")
    .attr("class", "x axis")
    .attr("transform", "translate(0," + height + ")")
    .call(xAxis);

svg.append("g")
    .attr("class", "y axis")
    .call(yAxis)
  .append("text")
    .attr("transform", "rotate(-90)")
    .attr("y", 6)
    .attr("dy", ".71em")
    .style("text-anchor", "end")
    .text("Price ($)");

svg.append("path")
    .datum(data)
    .attr("class", "line")
    .attr("d", line);


// EVENT

var eventData = [
{"name": "Summer Event", "startdate": "20-Apr-12",  "enddate": "23-Apr-12", "color": "#289615"},
{"name": "Refresh Event", "startdate": "22-Apr-12",  "enddate": "24-Apr-12", "color": "#BB70C2"},
{"name": "Special Event", "startdate": "28-Apr-12",  "enddate": "30-Apr-12", "color": "#D99332"}
];

// convert to proper JS date format
eventData.forEach(function(d) {
  d.startdate = parseDate(d.startdate);
  d.enddate = parseDate(d.enddate);
});


var eventHeight = function(d, i) { return (i % 2) ? height + 25 : height + 45 };

var eventInd = svg.selectAll(".eventInd")
  .data(eventData)
  .enter()
  .append("g")
  .attr("class", "eventInd")
;

eventInd.append("line")
  .attr("x1", function(d) { return x(d.startdate); })
  .attr("y1", 0)
  .attr("x2", function(d) { return x(d.startdate); })
  .attr("y2", function(d, i) { return eventHeight(d, i); })
  .attr("stroke", function(d) { return d.color; })
  .attr("class","eventlineborder")
;

// draw a line: end event
eventInd.append("line")
  .attr("x1", function(d) { return x(d.enddate); })
  .attr("y1", 0)
  .attr("x2", function(d) { return x(d.enddate); })
  .attr("y2", function(d, i) { return eventHeight(d, i); })
  .attr("stroke", function(d) { return d.color; })
  .attr("class","eventlineborder")
;

// draw a line: period connector event
eventInd.append("line")
  .attr("x1", function(d) { return x(d.startdate); })
  .attr("y1", function(d, i) { return eventHeight(d, i); })
  .attr("x2", function(d) { return x(d.enddate); })
  .attr("y2", function(d, i) { return eventHeight(d, i); })
  .attr("stroke", function(d) { return d.color; })
  .attr("class","eventlineconnector")
;

// add event label
eventInd.append("text")
  .attr("x", function(d) { return x(d.startdate) + ((x(d.enddate) - x(d.startdate))/2); })
  .attr("y", function(d, i) { return eventHeight(d, i) + 12; })
  .attr("class", "eventtitle")
  .attr("stroke", function(d) { return d.color; })
  .text(function(d) { return d.name; })
;

</script>
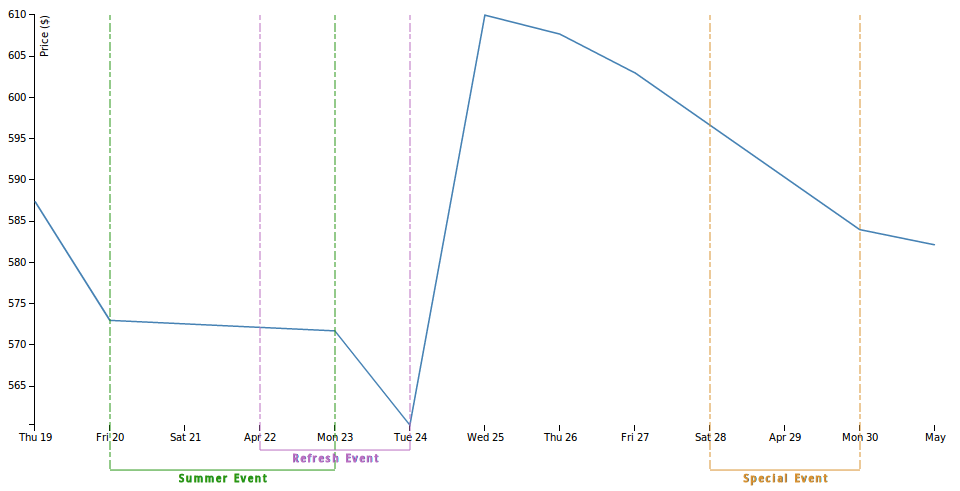
As you can see it is fairly straight forward implementing these requirements with D3js.
Using D3js Charts on the Pentaho BI Server
The first step is to install following components from the Pentaho Marketplace:
- Community Dashboard Framework
- Community Data Access
- Community Dashboard Editor
- D3 Component Library
The installation is very simple, so I will not cover it in more detail here.
Restart the server.
Next log in again and choose File > New > CDE Dashboard. I will not discuss any details about how the create these dashboards, because there are already plenty of tutorials available about this topi, but instead focus on the d3js part.
In a nutshell:
- Create a layout structure. Name the column, which should house the chart,
d3_chart. - Still on the same tab, click the Add Resource icon and add an inline (code snippet) CSS. Copy the CSS code from our original chart in there.
- Create a datasource. This one should point to the table which holds the daily closing data for the chart (the first dataset in our previous example).
-
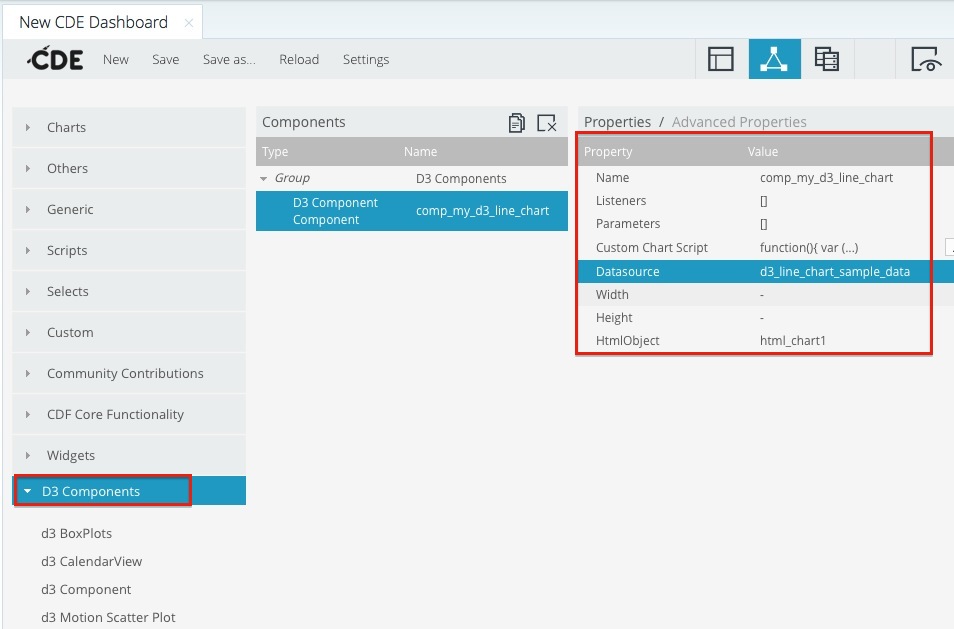
In the Components tab, from the left hand side choose D3 Components > D3 Component. Provide a name in the properties section and link it to the datasource and html object. Then click on the ellipsis icon next to Custom Chart Script. Start off by writing
function(dataset){}and paste the JavaScript code from our previous example inside the curly brackets. We just have to adjust theselect()part, so that the chart is rendered in the correctdiv:... var svg = d3.select("#d3_chart").append("svg") ...Note this binds the chart to the column of the name (in CDE terms - but actually an id)
d3_chart.It’s a good time now to save the chart and click the Preview icon on the upper right hand corner. You will see that our chart is now rendered properly.
Next we want to use the data returned by the CDE datasource. The output of this datasource is a bit different from than the one we used in our previous sample, so I just quickly added some code to transform it respectively:
function(dataset){

var data = [];

for(var i=0; i < dataset.resultset.length; i++){
    var dataObject = {};
    dataObject.date = dataset.resultset[i][0];
    dataObject.close = dataset.resultset[i][1];
    data.push(dataObject);
    }

// code from our previous sample goes here (whithout the main static dataset

}
Note: In some d3js samples Webdetails used a
cdaResultToD3Array()to do just do the same.
Our chart works smoothly with the dynamic datasource now on the Pentaho BI Server. As a final exercise you can make the datasource for the events dynamic, but I’ll leave this up to you.
UPDATE 2015-04-02: Currently the D3 Component Library doesn’t seem to be available via the Marketplace. This is not a major issue tough: Just upload d3.min.js to the BA Server and reference it from within your dashboard (Resource: external JavaScript). Then add a Query Component. Provide out the usual settings, define a Result Var name, e.g. dataset. Then you can add all your D3 code to the PostExecution function. Note that with this component, the data has to be prepared similar to the example shown below:
var data = [];

for(var i=0; i < dataset.length; i++){
    var dataObject = {};
    dataObject.date = dataset[i][0];
    dataObject.close = dataset[i][1];
    data.push(dataObject);
    }