In some unusual scenarios you have to pick a specific subset of leaf members of a given hierarchy and at the same time the request is that the aggregations of the parents (and any ascendants for that matter) should only be based on the selected leaf members. Certainly this can be implemented on various levels, but we decided that a MDX query would be the best place to do it. As Nelson Sousa highlighted, you could also achieve the same by disabling access to this particular leaf member in the Mondrian security settings.
As you can see in the results below, filtering on leaf members does not adjust the totals for their ascendants … even though we only chose February in the query below, the sales for the first quarter reflects those of all months!
SELECT
  HIERARCHIZE(ASCENDANTS([Time].[2003].[QTR1].[Feb])) ON ROWS
  , [Measures].[Sales] ON COLUMNS
FROM [SteelWheelsSales]
| Time | Sales |
|---|---|
| All Years | 10,645,949 |
| 2003 | 3,677,384 |
| QTR1 | 445,095 |
| Feb | 140,836 |
The key strategy seems to be in creating a dedicated calculated measure (see also Filtered Measures (Tuple Measures)):
WITH
MEMBER [Measures].[Sales Constrained] AS
(
  [Measures].[Sales],  [Time].[2003].[QTR1].[Feb]
)
SELECT
  HIERARCHIZE(ASCENDANTS([Time].[2003].[QTR1].[Feb])) ON ROWS
  , {[Measures].[Sales], [Measures].[Sales Constrained]} ON COLUMNS
FROM [SteelWheelsSales]
| Time | Sales | Sales Constrained |
|---|---|---|
| All Years | 10,645,949 | 140,836 |
| 2003 | 3,677,384 | 140,836 |
| QTR1 | 445,095 | 140,836 |
| Feb | 140,836 | 140,836 |
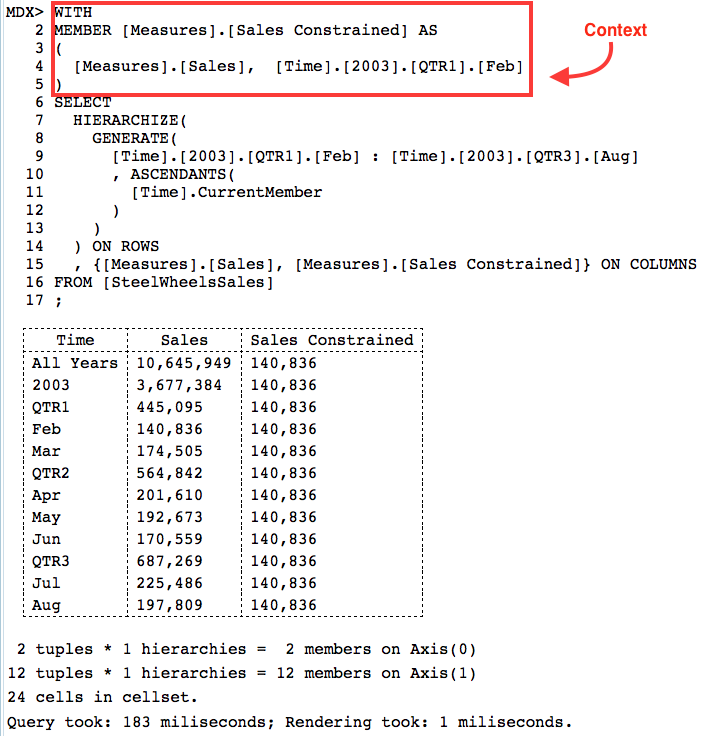
This looks quite promising at first, however, all is not what it seems to be: Just try to add a few other time members: If we want to apply the same principal on a set (in our a case a time period), things get a bit more trick. We can use the GENERATE() function in combination with the ASCENDENTS (or even ANCESTOR) function (as shown here):
WITH
MEMBER [Measures].[Sales Constrained] AS
(
  [Measures].[Sales],  [Time].[2003].[QTR1].[Feb]
)
SELECT
  HIERARCHIZE(
    GENERATE(
      [Time].[2003].[QTR1].[Feb] : [Time].[2003].[QTR3].[Aug]
      , ASCENDANTS(
        [Time].CurrentMember
      )
    )
  ) ON ROWS
  , {[Measures].[Sales], [Measures].[Sales Constrained]} ON COLUMNS
FROM [SteelWheelsSales]
;
| Time | Sales | Sales Constrained |
|---|---|---|
| All Years | 10,645,949 | 140,836 |
| 2003 | 3,677,384 | 140,836 |
| QTR1 | 445,095 | 140,836 |
| Feb | 140,836 | 140,836 |
| Mar | 174,505 | 140,836 |
| QTR2 | 564,842 | 140,836 |
| Apr | 201,610 | 140,836 |
| May | 192,673 | 140,836 |
| Jun | 170,559 | 140,836 |
| QTR3 | 687,269 | 140,836 |
| Jul | 225,486 | 140,836 |
| Aug | 197,809 | 140,836 |
What just happened? We have the same [Measures].[Sales Constrained] figure for any time member!?
There is a very important concept to understand here: In which context does the calculated member get evaluated?
As it turns out, only within the WITH section: Indeed, we defined [Measures].[Sales Constrained] as the intersection of [Time].[2003].[QTR1].[Feb] and [Measures].[Sales] and it will keep this context (and not the whole cube) whereever we decide to place it in the resultset!
Pretty much the same happens if we decide to include more time members:
WITH
SET [myPeriod] AS (
[Time].[2003].[QTR1].[Feb] : [Time].[2003].[QTR3].[Aug]
)
MEMBER [Measures].[Sales Constrained] AS
(
  [myPeriod].Current.Item(0),[Measures].[Sales]
)
SELECT
  HIERARCHIZE(
    GENERATE(
      [myPeriod]
      , ASCENDANTS(
        [Time].CurrentMember
      )
    )
  ) ON ROWS
  , {[Measures].[Sales],  [Measures].[Sales Constrained] } ON COLUMNS
FROM [SteelWheelsSales]
| Time | Sales | Sales Constrained |
|---|---|---|
| All Years | 10,645,949 | 197,809 |
| 2003 | 3,677,384 | 197,809 |
| QTR1 | 445,095 | 197,809 |
| Feb | 140,836 | 197,809 |
| Mar | 174,505 | 197,809 |
| QTR2 | 564,842 | 197,809 |
| Apr | 201,610 | 197,809 |
| May | 192,673 | 197,809 |
| Jun | 170,559 | 197,809 |
| QTR3 | 687,269 | 197,809 |
| Jul | 225,486 | 197,809 |
| Aug | 197,809 | 197,809 |
Working Version
I was given a challenge to come up with a working MDX query for the last example shown in this blog post. After many hours trying to get a solution, I gave up. In the end I asked one of my colleagues, Nelson Sousa, to take a look at this and come up with the working solution, which took him about 2 minutes (yes, he’s that good at writing MDX queries!). I just asked him how to exclude a San Francisco from the resultset for the SteelWheelsSales cube, also excluding it from any roll-ups:
WITH MEMBER [Measures].[Curated Sales] AS
  AGGREGATE(
    EXCEPT(
      DESCENDANTS(
       [Markets].CurrentMember
       , [Markets].[City]
      )
      , [Markets].[NA].[USA].[CA].[San Francisco]
    )
    , [Measures].[Sales]
  )
SELECT
  FILTER(
    DESCENDANTS(
      [Markets].[NA]
      , [Markets].[City], SELF_AND_BEFORE
    )
    , [Markets].CurrentMember.UniqueName <> '[Markets].[NA].[USA].[CA].[San Francisco]'
  )
  ON ROWS
  , { [Measures].[Sales], [Measures].[Curated Sales] } ON COLUMNS
FROM [SteelWheelsSales]
How the calculated member [Measures].[Curated Sales] works:
- Using the
DESCENDANTSfunction we retrieve the[City]level for the current member. It’s important to grasp this concept: Basically we have to build a calculated member which can be correctly evaluated for every[Markets]member at any hierarchy level. So basically we are saying: For each member you find on any[Markets]hierarchy level return the set of leaf members (in our case donated by[Markets].[City]). - Having found all the relevant leaf members for the respective
[Markets]member, we want toEXCLUDE()San Francisco from this set. - Finally we ask the set to be
AGGREGATE()d by[Measures].[Sales]. Keep in mind that the calculated measure not only has to work on the leaf members ([Markets].[City]) but also their parents and grandparents. TheAGGREGATE()function ensures that the sales figures are summed up (in this case) when a higher level is selected.
The Select statement:
- Using the
DESCENDANTS()we display all the levels with their members between[Markets].[NA]and[Markets].[City]. Note that this is different from the approach chosen in the calculated member as here we want to display the whole hierarchy, whereas for the calculated member to yield the correct results we require the leaf level only! For the select statement we could have also made use of theASCENDANTS()function, however, this one is less flexible as it only shows all hiearchy levels. - The
FILTER()is only cosmetical: We just do not want to show San Franciso in the resultset. This does not influence the results of the calculated member in any way. - We display our standard and curated sales measures on columns to properly understand if our calculation is working as expected.
Next, let’s create a new example with the same strategy:
WITH
MEMBER [Measures].[Curated Sales] AS
  AGGREGATE(
    EXCEPT(
      DESCENDANTS(
       [Time].CurrentMember
       , [Time].[Months]
      )
      , [Time].[2003].[QTR1].[Feb]
    )
    , [Measures].[Sales]
  )
SELECT
  [Time].AllMembers ON ROWS
  , {[Measures].[Sales],  [Measures].[Curated Sales] } ON COLUMNS
FROM [SteelWheelsSales]
Finally we’d like to only look a subset of members, in our case let’s focus on a time period:
WITH
SET [myPeriod] AS (
  [Time].[2003].[QTR1].[Feb] : [Time].[2003].[QTR3].[Aug]
)
SET [myPeriodNegated] AS
  EXCEPT(
    [Time].[Months].Members
    , [myPeriod]
  )
MEMBER [Measures].[Curated Sales] AS
  AGGREGATE(
    EXCEPT(
      DESCENDANTS(
       [Time].CurrentMember
       , [Time].[Months]
      )
      , [myPeriodNegated]
    )
    , [Measures].[Sales]
  )
SELECT
  HIERARCHIZE(
    GENERATE(
      [myPeriod]
      , ASCENDANTS(
        [Time].CurrentMember
      )
    )
  ) ON ROWS
  , {[Measures].[Sales],  [Measures].[Curated Sales] } ON COLUMNS
FROM [SteelWheelsSales]
The interesting part here is to turn the time period set into a new set which shows their hierarchical relationship. This is accomplished by using the GENERATE() function.