CDE Table Component Setup and MDX Drilldownmember
MDX is an extremely powerful query language. Over the years I got exposed to various MDX functions, some of which I only started to appreciate later on, when I was facing a particular challenge. One of such function was DRILLDOWNMEMBER. I read about this function a long time ago but only recently used it in a project.
A few days ago I was asked to put together a CDE dashboard for a client. The specs were really quite straight forward: Display a high level summary and allow us to drill down. Now you’d be inclined to think that this is quite a popular request and hence CDE has something in store to cover this scenario: Well, the table component has an Expand on click feature, which displays an inline table, which is not as elegant for this purpose as a drill down in Analyzer, Saiku or even JPivot. So here is how I tackled the challenge:
We are discussing how to create a Pentaho CDE dashboard here, so I expect that you are familiar with the concepts of CDE. I also expect that you have a good understanding of MDX.
We will be using the SteelWheelsSales Cube, which ships with every Pentaho Server. For this example I am using the current version 7. Download it via SourceForge. We will provide drill down functionality for the Product Dimension. The product dimension has following level (top to bottom):
- Line
- Vendor
- Product
To familiarse yourself with the SteelWheelsSales Mondrian schema, you can play around with it using good old (shall I say very old and trusted) JPivot (via File > New > JPivot View) and you can also download the Mondrian Schema via File > Manage Data Sources.
In JPivot click the MDX button and run following query:
WITH
	MEMBER [Measures].[Member Full Path] AS
		[Product].CurrentMember.UniqueName
	MEMBER [Measures].[Member Ordinal] AS
		[Product].CurrentMember.Ordinal
SELECT
	NON EMPTY
	  Descendants([Product].[(All)].Members, 1, SELF_AND_BEFORE)
	ON ROWS
	, {
		[Measures].[Member Full Path]
		, [Measures].[Member Ordinal]
		, [Measures].[Sales]
	} ON COLUMNS
FROM [SteelWheelsSales]
WHERE [Time].[Years].[2004]
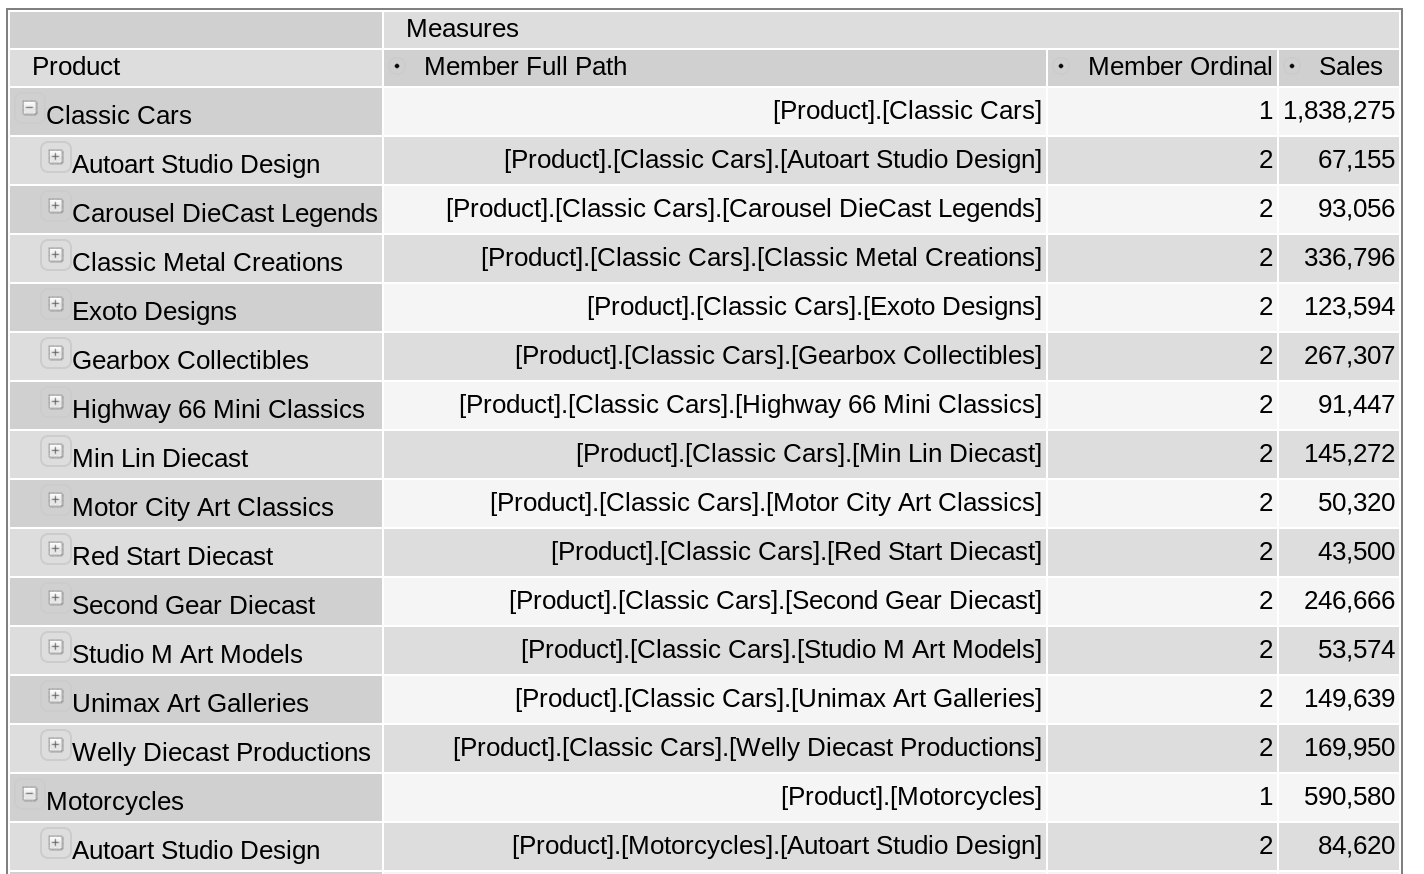
Click on the Apply button and JPivot will swiftly return the resultset. Partial screenshot below:
Next create a CDE dashboard (New > CDE Dashboard). I will not go through all the details on how to create this, just mention a few main points.
Create the layout
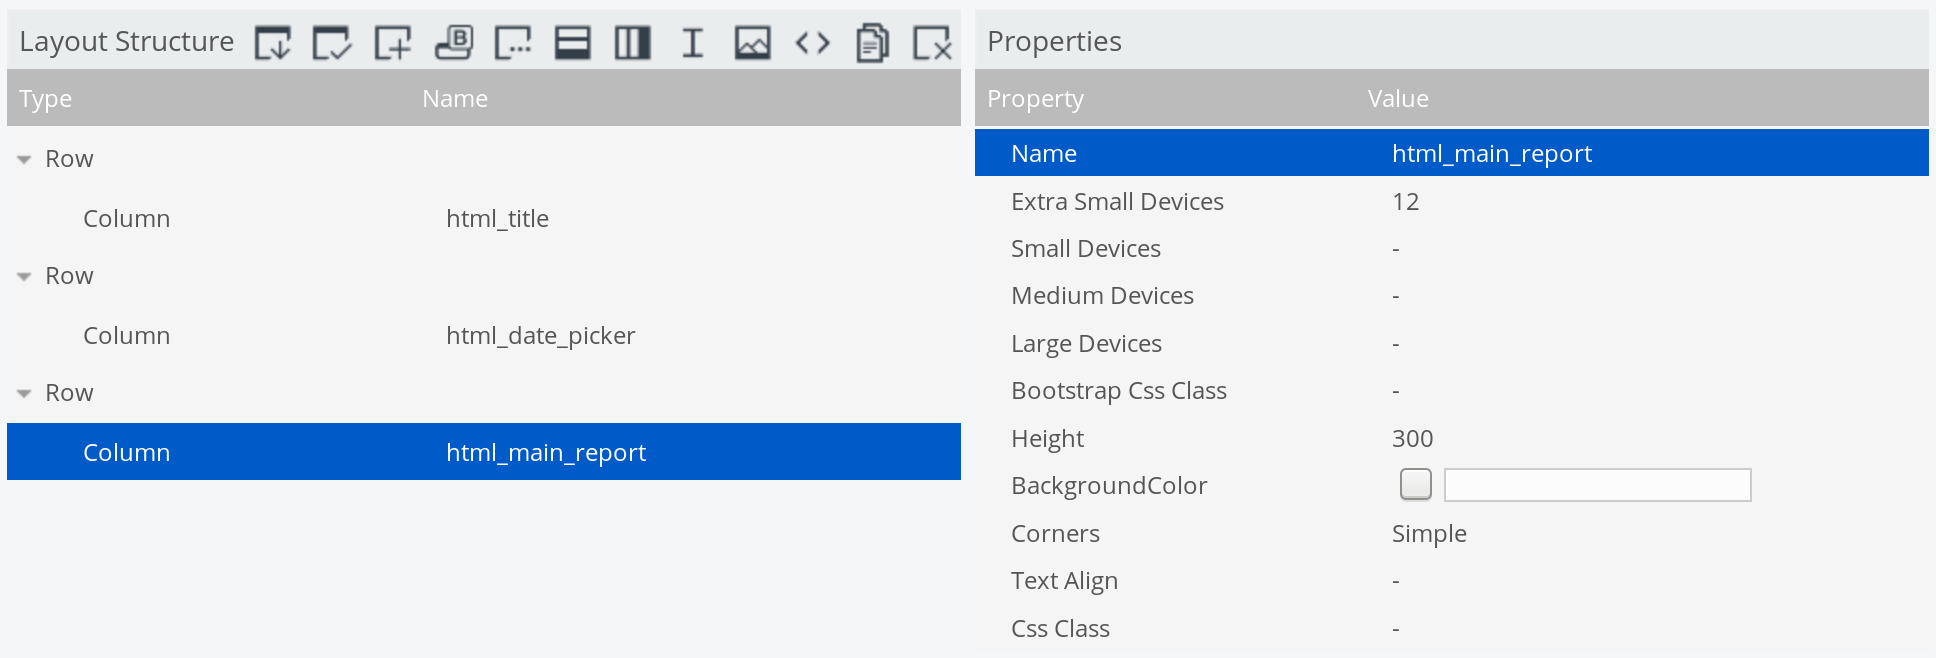
In the Layout add a super simple structure: 3 rows with one column each. Set the columns to 12 (Extra Small Devices) and name them html_title, html_date_picker, html_main_report:
Remove all the height settings (default 300) from the row and column elements. Inside the html_title column add an HTML element and insert following content:
<h1>SteelWheels <small>Sales By Product</small></h1>
Set the height of the html_date_picker to 60.
Creating the year picker
The end user should be able to choose the reporting year. For this purpose we can simply use Select component and parameter called param_year.
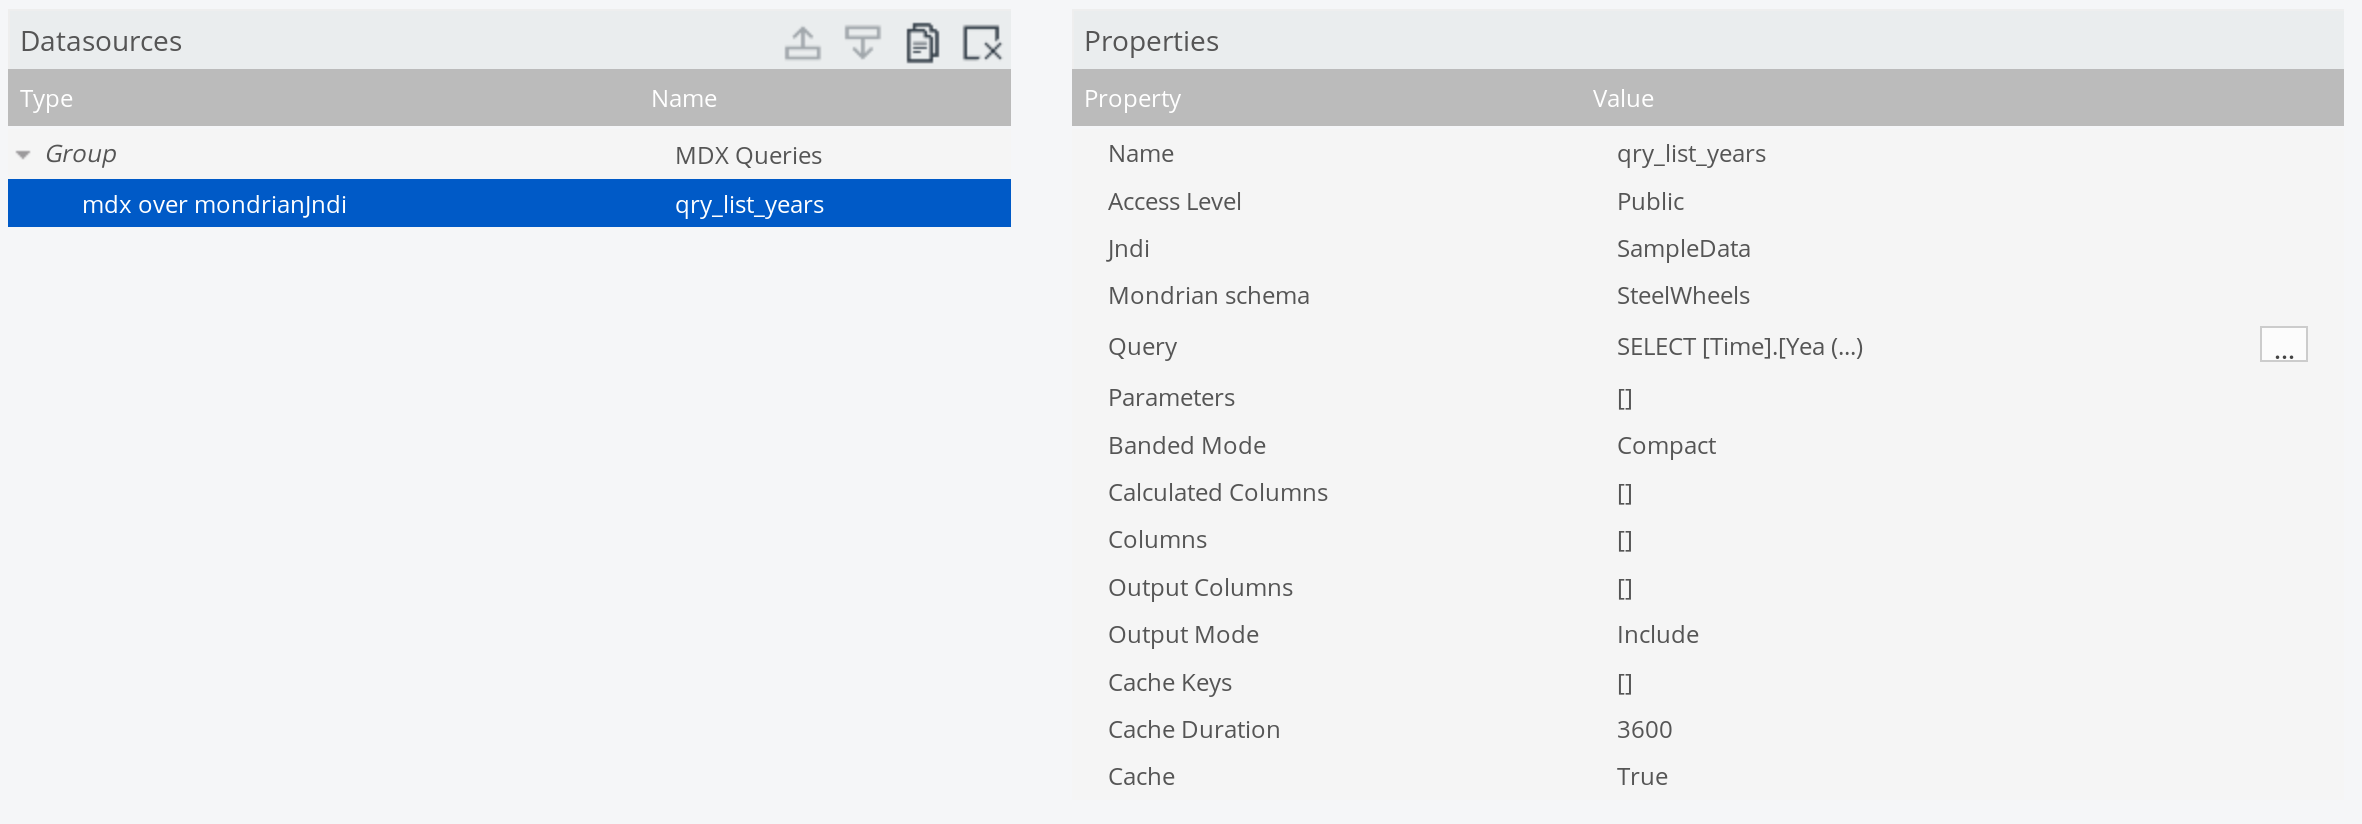
To drive the Select component we use the following MDX query using a mdx over mondrianJndi data source (from the Data Source Panel called qry_list_years:
SELECT
  [Time].[Years].Members ON ROWS
  , {} ON COLUMNS
 FROM [SteelWheelsSales]
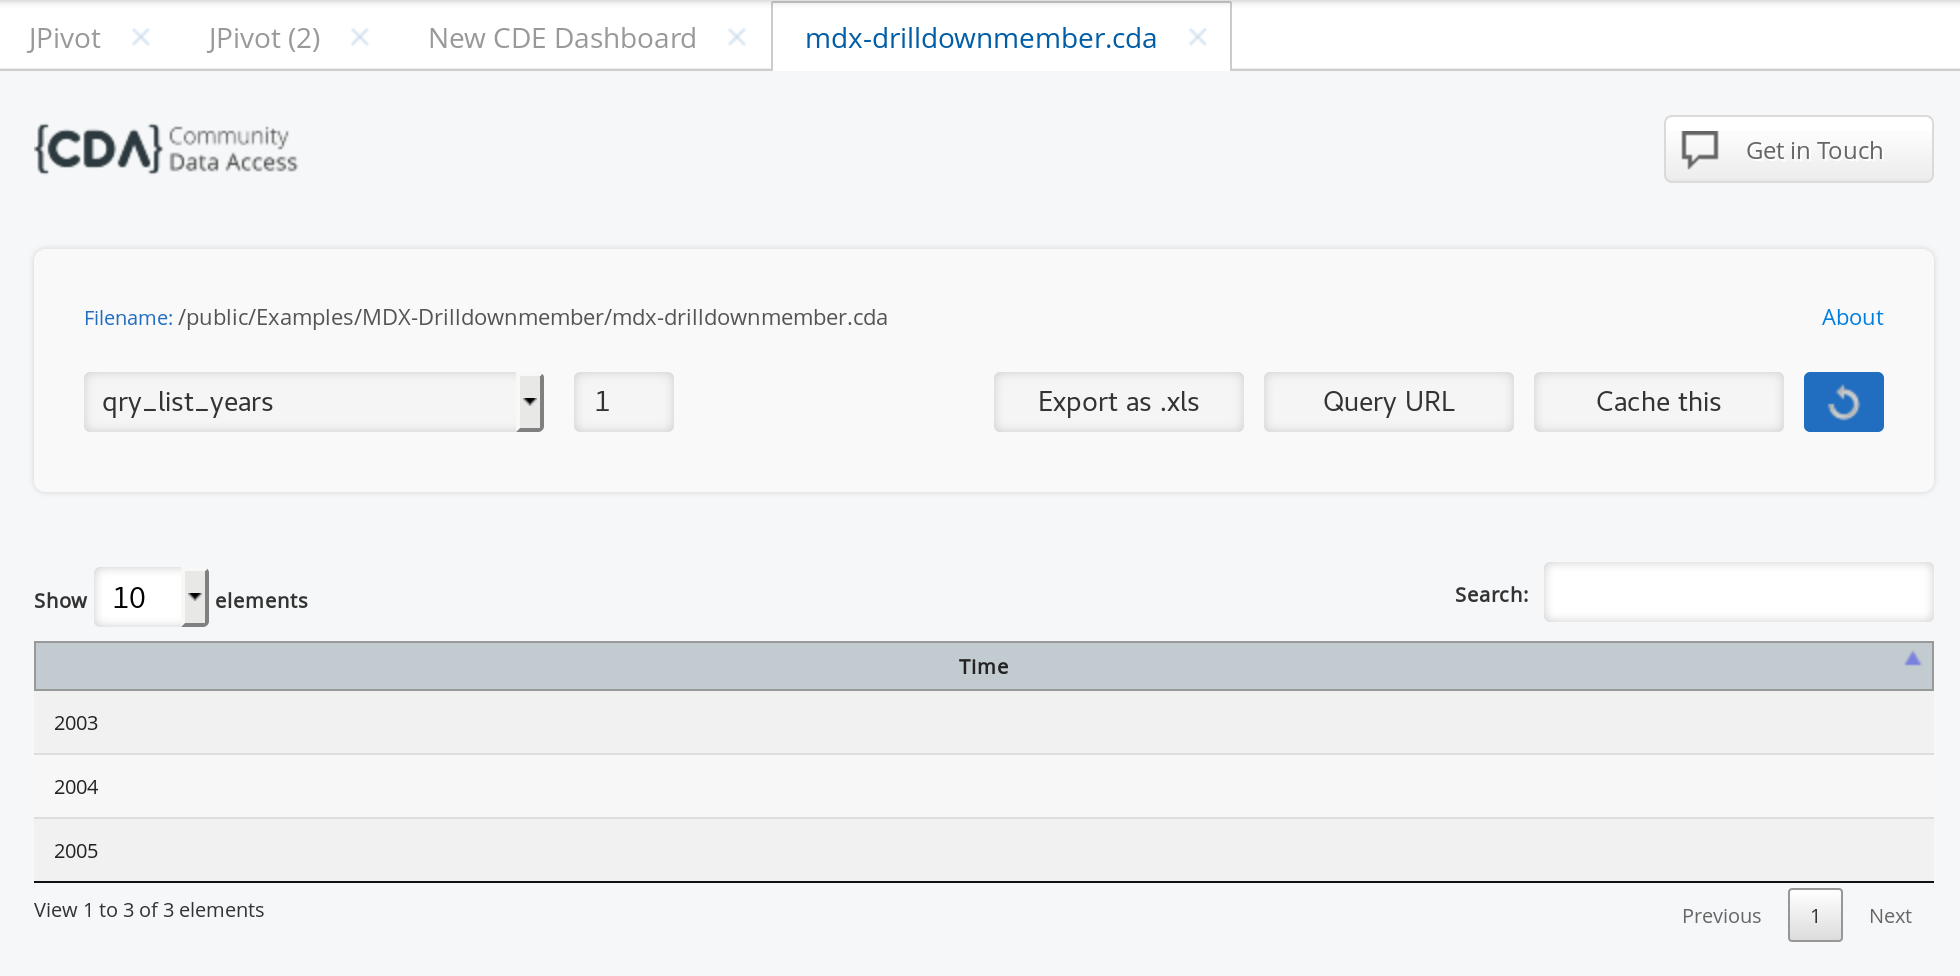
Note: Once you save the dashboard, in the same folder you’ll find a CDA (Community Data Access) file. Double click on it and you will be able to preview the data for each query you define in the dashboard. Ultra handy! Just make sure you refresh the tab once you define a new query:
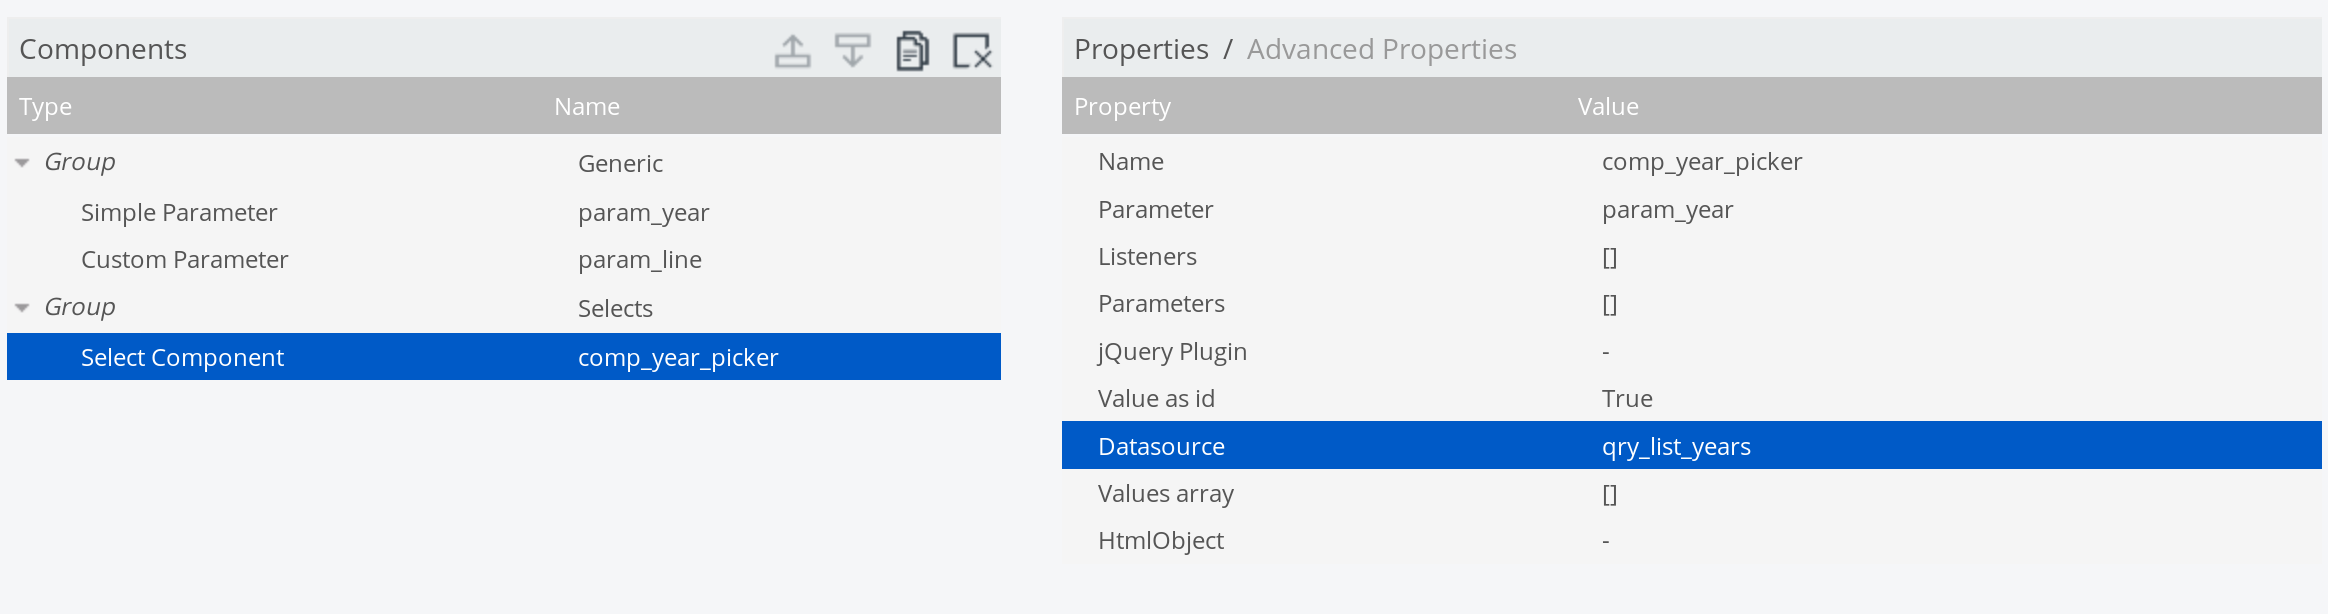
Next create a Simple Parameter (Generic > Simple Parameter) in the Components Panel and set the Prototype value to 2014 (this is the default value). Then add a Select Component (Selects > Select Component), call it comp_year_picker, assign the parameter param_year, the data source qry_list_years and the html object html_date_picker:
Create the report (table)
For the drill down functionality, we create a custom parameter called param_line and set its default value to:
"Descendants([Product].[(All)].Members, 1, SELF_AND_BEFORE)"
Just be warned, I start off by doing things in the wrong way and then gradually show you how to get it right, to perfectly illustrate best practices. There is always more than one way to do things, but not necessarily all approach are good ones.
This query will display the overall summary (the All level) as well as the first level and its members.
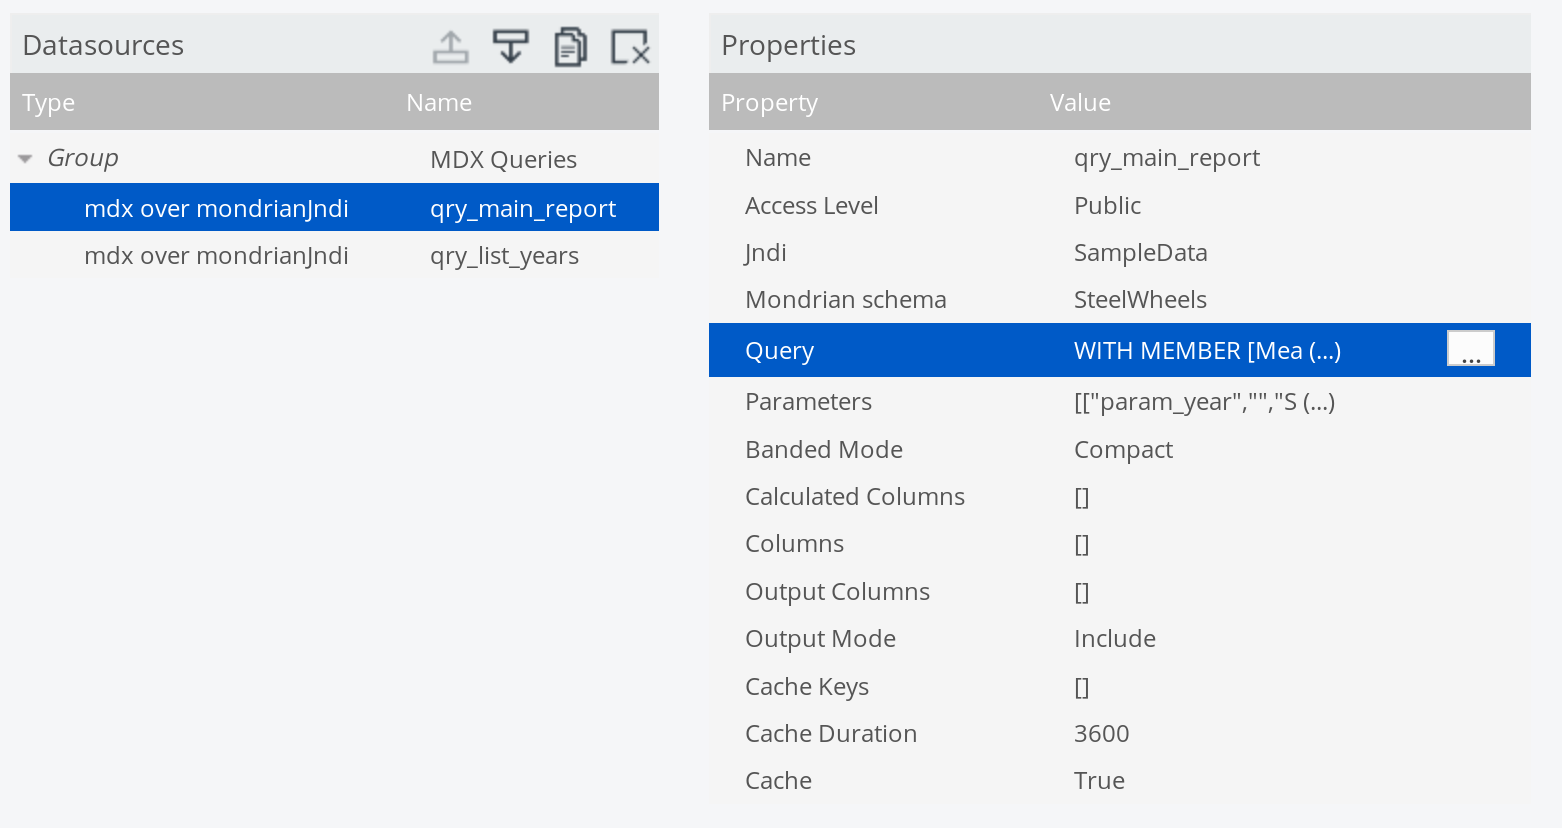
Next define the MDX query called qry_main_report and register both parameters (param_year and param_line) with it.
Important: Make sure that you do not define any default values for
param_linewhen you pass down the parameters to a component or MDX query! So in example, when you define the parameter for the MDX query in CDE, leave theValuefield empty.
The MDX query should look something like this:
WITH
    MEMBER [Measures].[Member Full Path] AS
		[Product].CurrentMember.UniqueName
	MEMBER [Measures].[Member Ordinal] AS
		[Product].CurrentMember.Ordinal
SELECT
	NON EMPTY
	  ${param_line}
	ON ROWS
	, {
		[Measures].[Member Full Path]
		, [Measures].[Member Ordinal]
		, [Measures].[Sales]
	} ON COLUMNS
FROM [SteelWheelsSales]
WHERE [Time].[Years].[${param_year}]
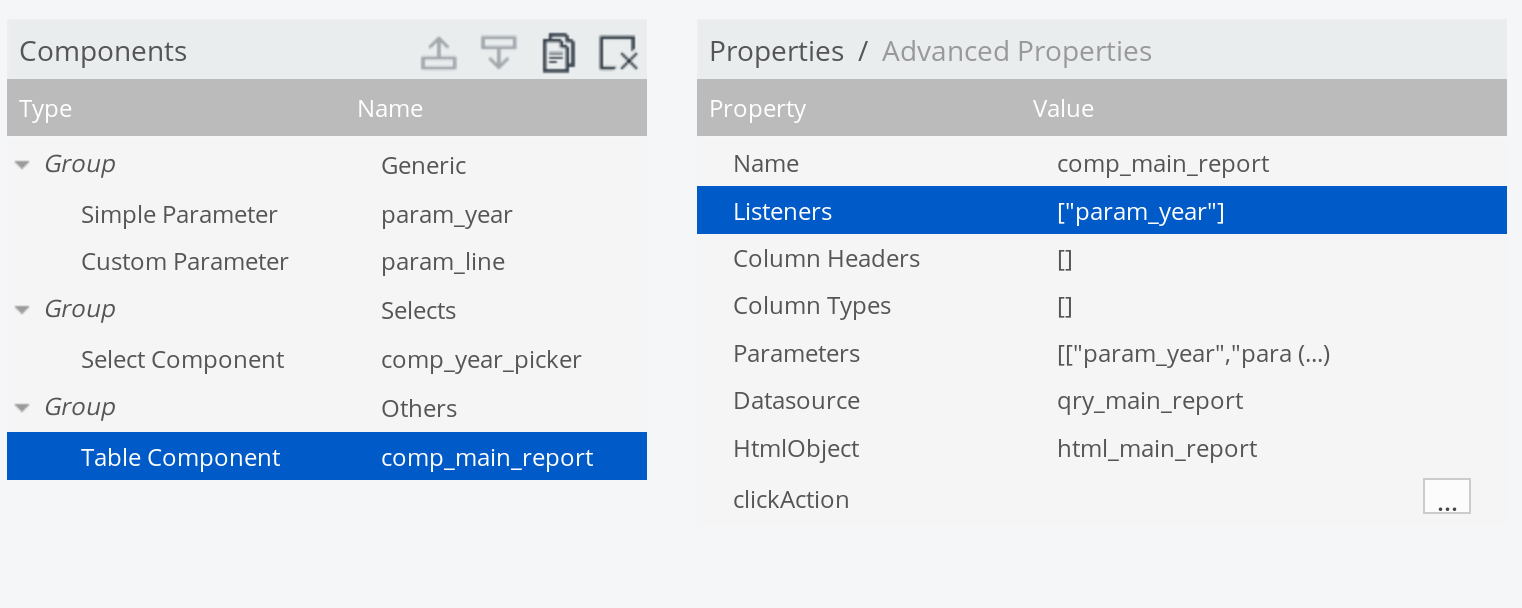
Next, in the Components Panel, add a table component (Others > Table Component), name it comp_main_report, assign the query qry_main_report and the html object html_main_report. Notice the consistent naming convention here: It is always good practice! As Listener define param_year and as Parameters param_year and param_line.
Next click on Advanced Properties set following properties to False:
- Show Filter
- Info Filter
- Length Change
- Paginate
- Sort Data
Set Style to Bootstrap.
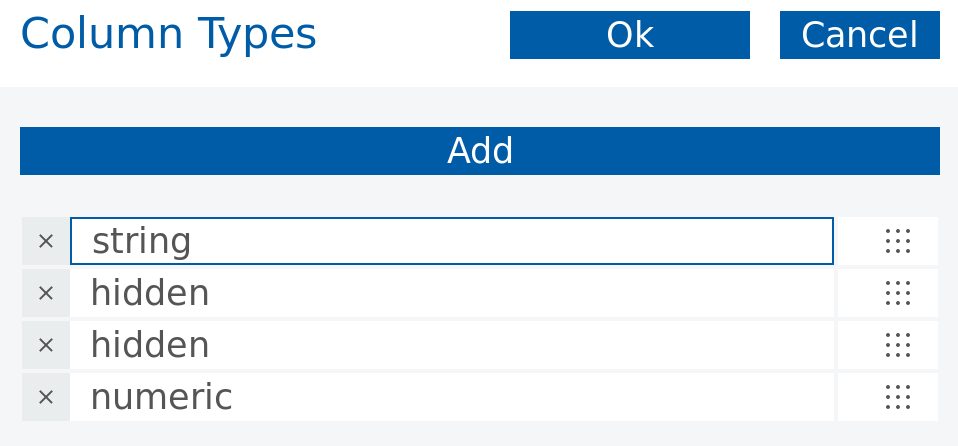
Set the Column Types to String, String, Numeric and Numeric.
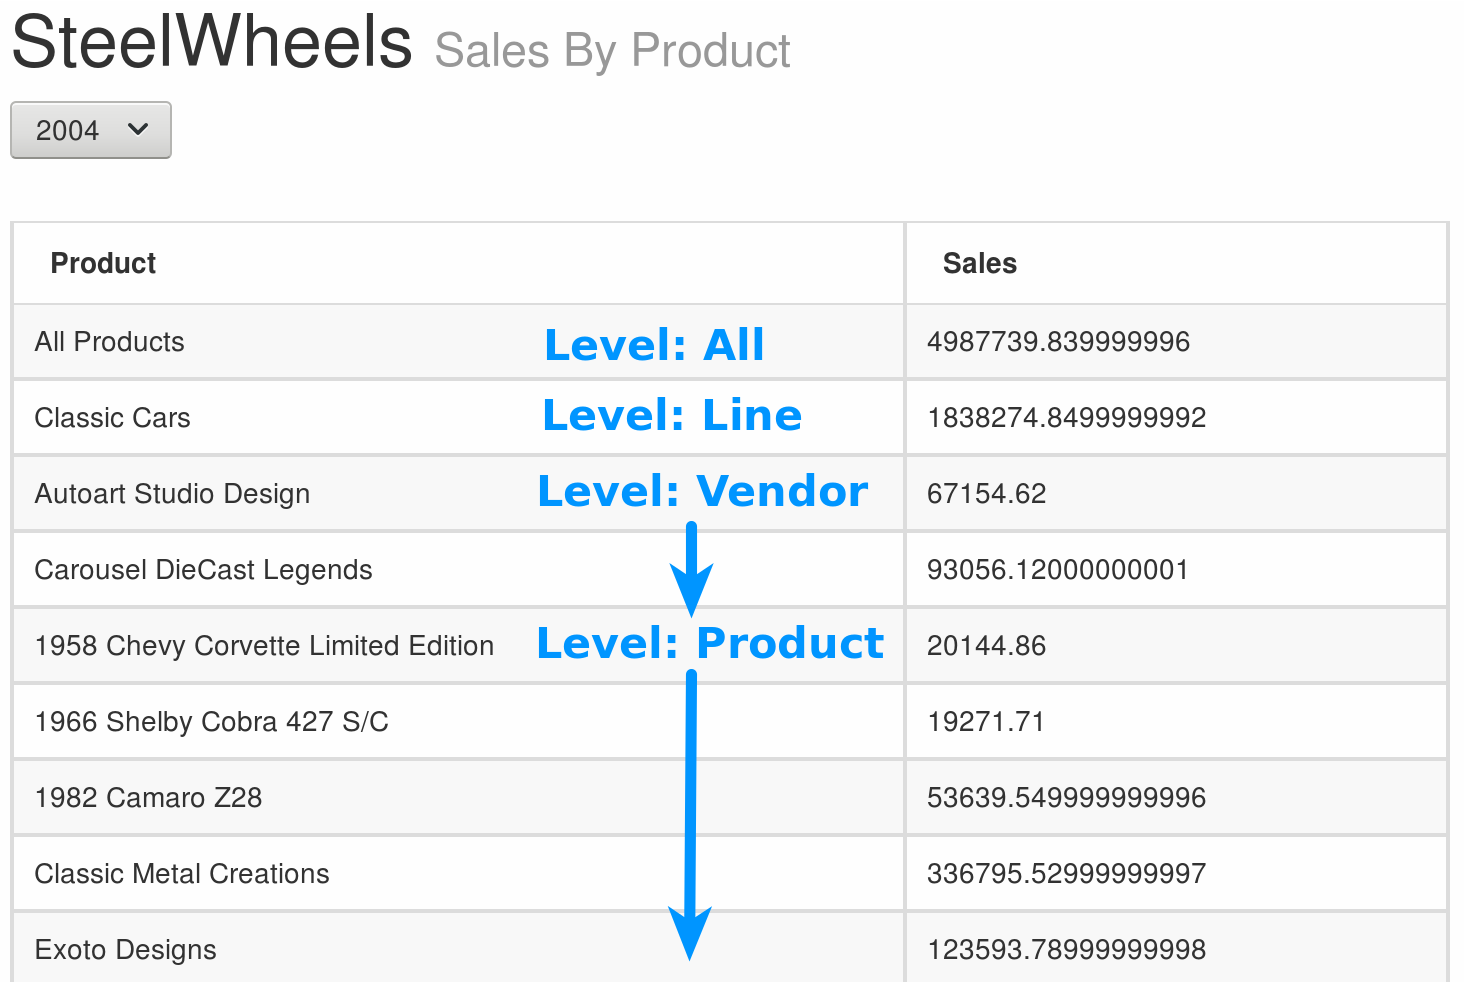
We will use all the columns return by the MDX query (including the full path column, which we will hide later on). We can use the Member Ordinal value later on to add conditional formatting for the table so that it is easier to read.
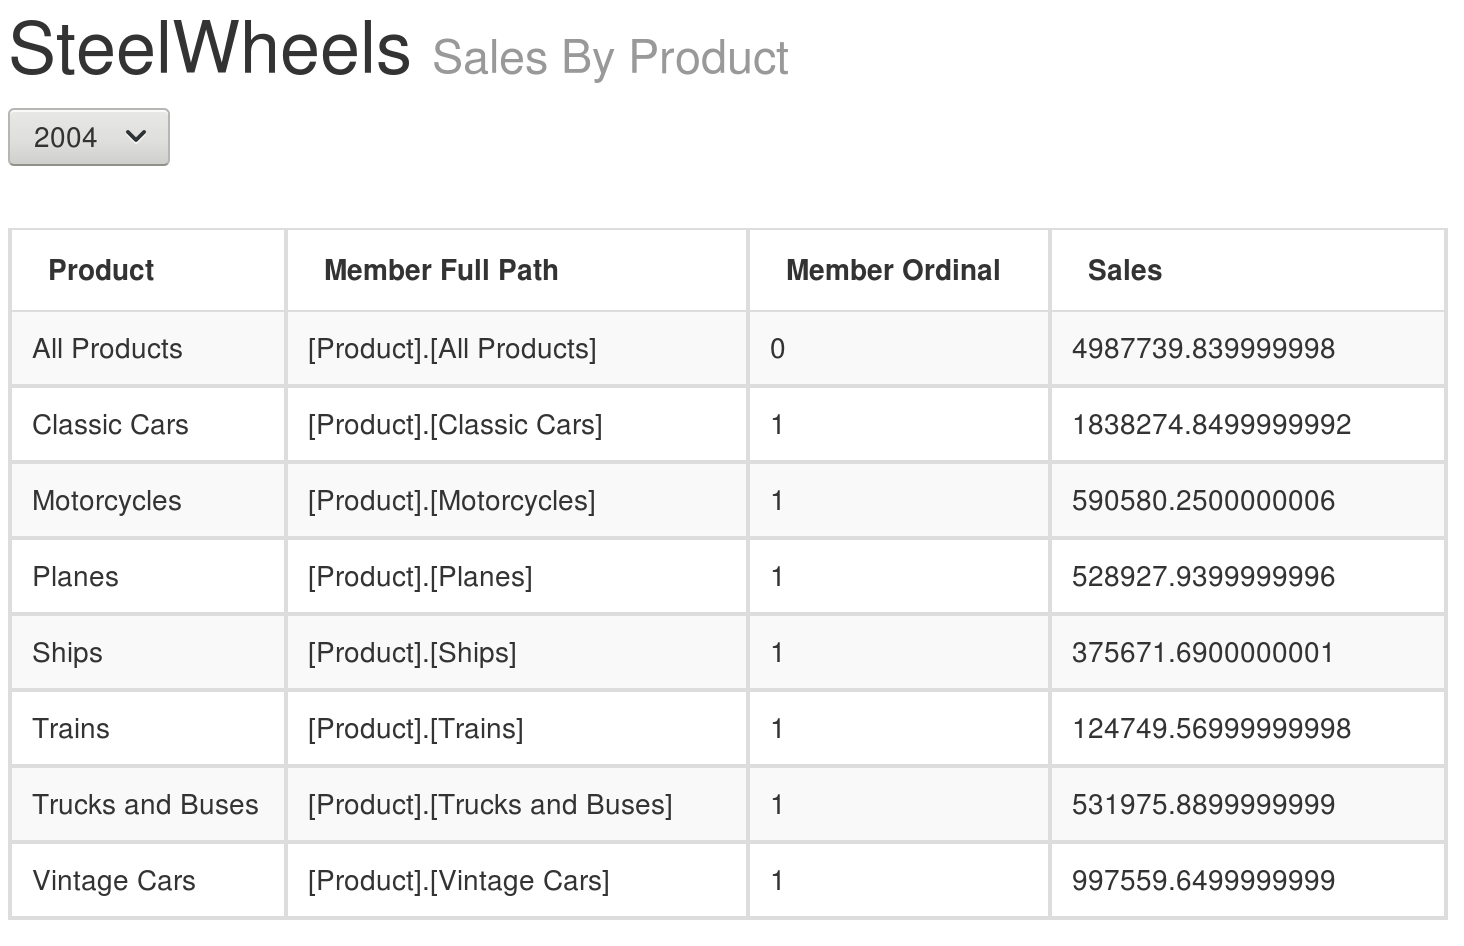
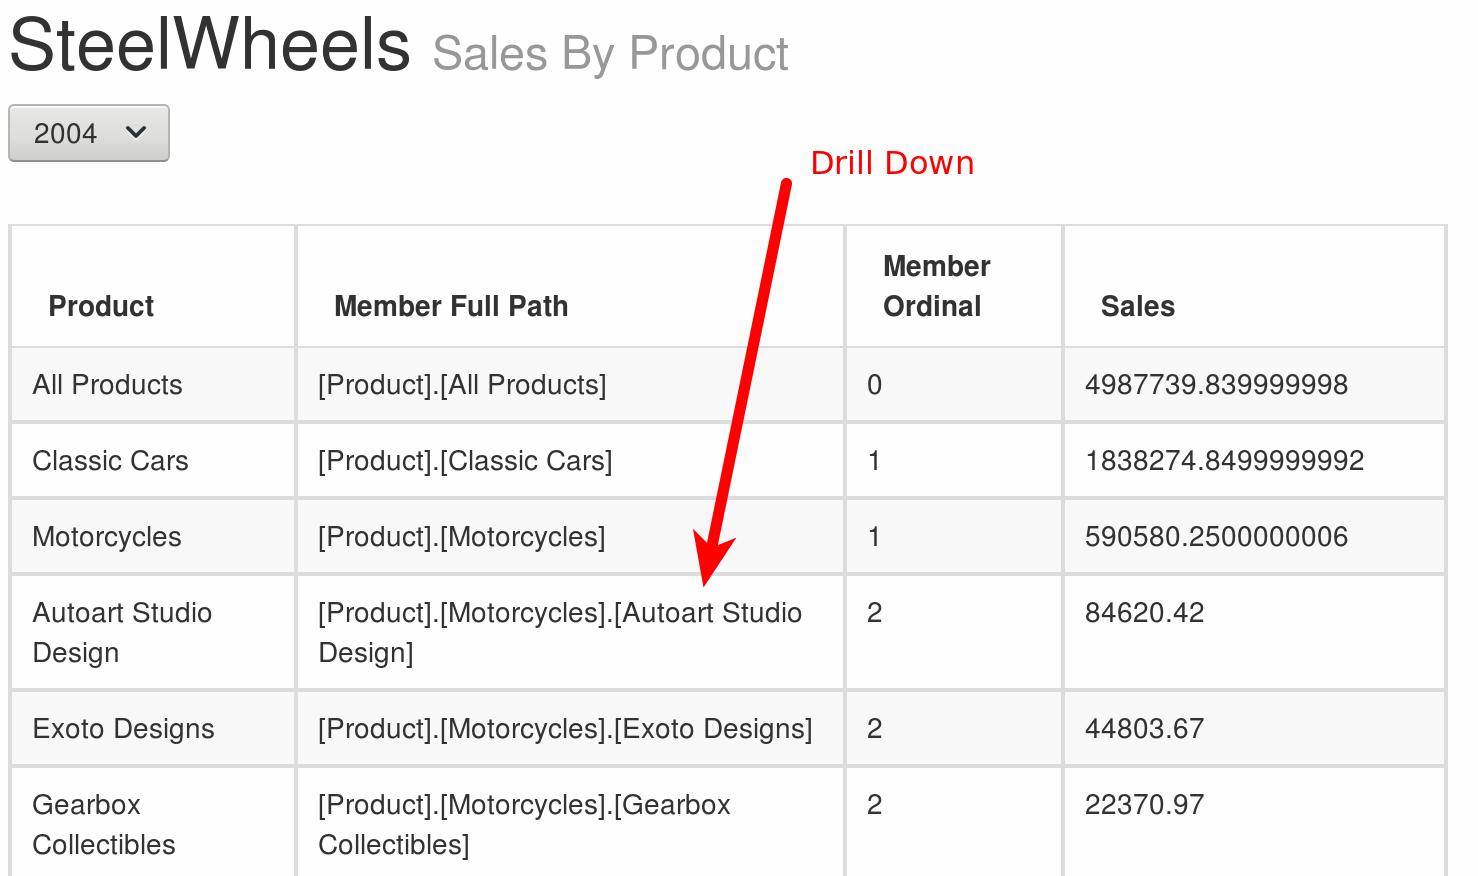
Preview the dashboard (or even better open the dashboard in a separate window/tab). It should like this now:
A very nice benefit of using DRILLDOWNMEMBER is that the amount of returned columns/fields does not change. If we drill down, only the children’s names will be displayed. So we do not have to change the table layout for the drill down.
Let’s implement the first drill down now. For the table component’s PostExecution function we define the following:
function(){
	$('#html_main_reportTable > tbody > tr').on({
		click: function(e){
			// get text value user clicked on
			// in this case we want to pick up the full MDX path of the member
			var chosenPath = e.originalEvent.originalTarget.firstChild.data;
			console.log("Requesting data for: " + chosenPath);
			var mdxFragment =
				"DRILLDOWNMEMBER(DESCENDANTS([Product], 1, SELF_AND_BEFORE),"
				+ chosenPath
				+ ")"
			;
			// update parameter value with chosen member
			dashboard.fireChange("param_line", mdxFragment);
		}
	})
}
The above snippet will make sure that we pick up the full path / unique name of the member the end user want to drill down on. We then update the parameter value for param_line with the chosen value. Now make the table component listen to this very parameter (adjust the Listener), so it will auto-refresh once the parameter value gets changed.
Preview the dashboard and click on the [Product].[Motorcycles] Member Full Path table cell (the click action currently only works on this column) and you will see the table refreshing to show the children (partial screenshot only):
Now while the above works, it is not a good idea! There are two problems:
- The MDX can be easily injected because it is generated client-side. The logic should sit within the MDX query itself.
- There is no need for HTML scrapping: CDE offers a Click Action event, which offers easy access to the required info (so there is no need to use jQuery here).
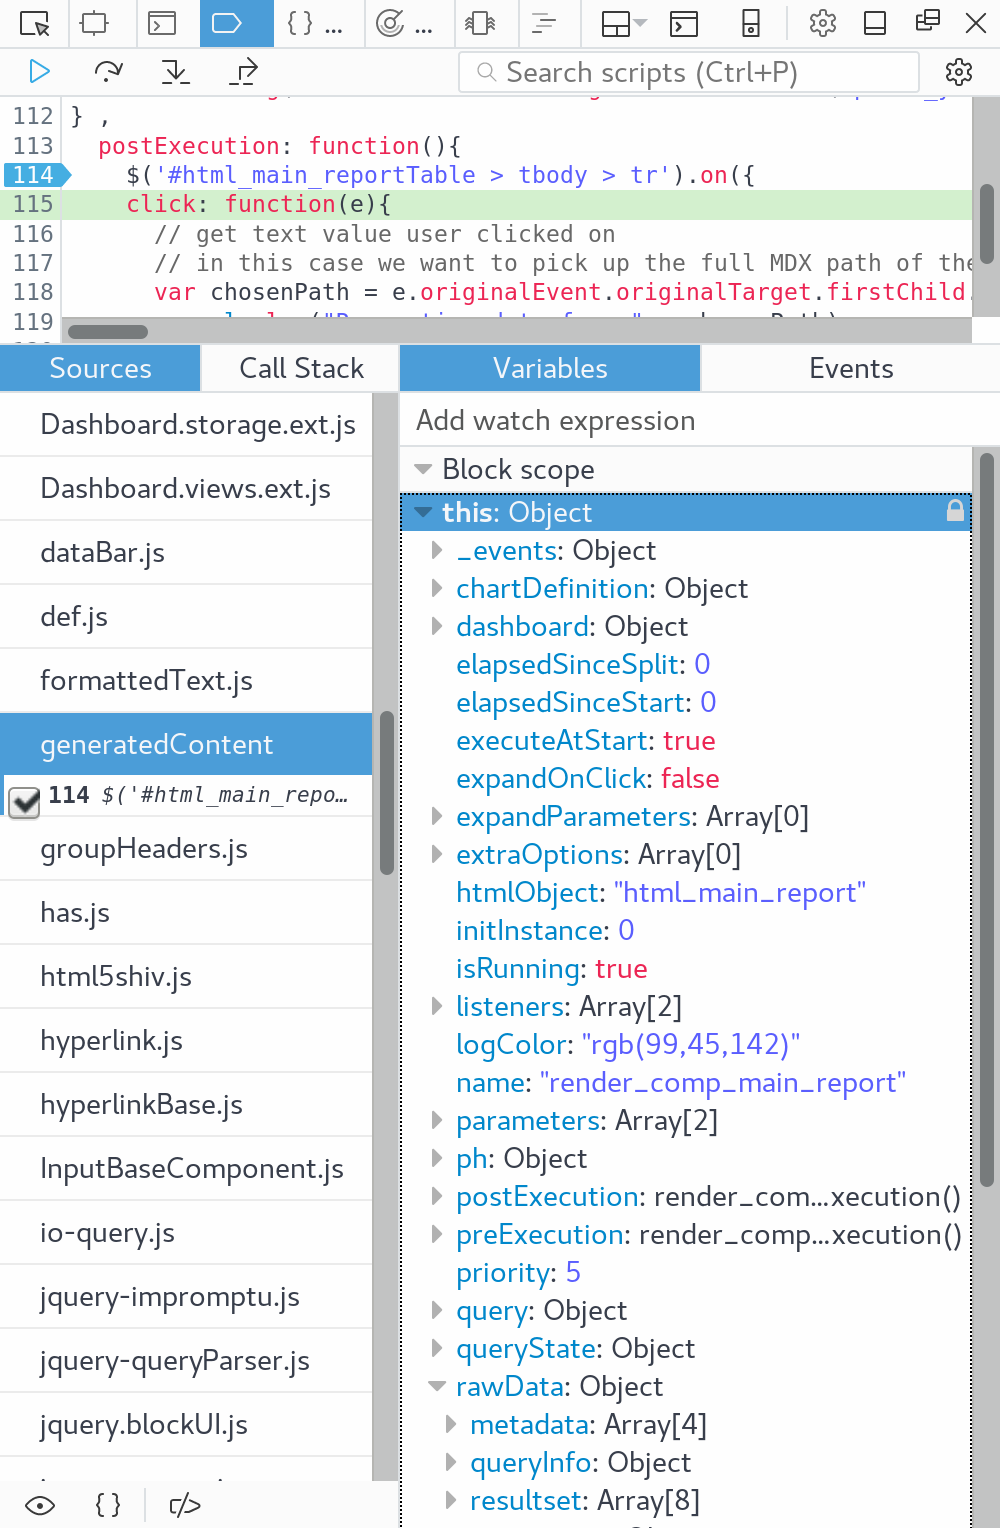
We can actually get hold of the underlying data itself instead of using jQuery to extract the values from HTML: There is a real separation between data and presentation. While looking at the rendered dashboard in a separate tab, open the dashboard (with the parameter in the URL debug=true) in this tab. I am using Firefox, so the explanations that follow are specific to this browsers, but other browser have a similar feature as well. Go to Developer Tools and then click on Debugger. In the Sources pane on the left find generatedContent and click on it. Find the postExecution function in the code that relates to your table component and just within the function definition right click on the line number and choose Add Breakpoint:
Reload the dashboard - at the bottom of the Debug tab you’ll find a Variables pane which will allow you to inspect the this object (or alternatively type in the Console this and hit enter). The current this object will be returned (so this object generated within the clickAction function where we set the breakpoint). If you explore the this object, you will see that it has a rawData property which in turn holds the resultset. So we can extract the required context info from there. Thanks to Nelson Sousa for showing me this and highlighting the problems mentioned above.
Go ahead and play with the object a bit in the Console to get familiar with it, e.g.:
this.rawData.resultset
// get the value of the second row and second column/field
this.rawData.resultset[1][1]
this.rawData.resultset.forEach(function(r, i){ console.log(r[0] + ", index: " + i);})
this.rawData.resultset.forEach(function(r, i){ if(r[0] == "Credits") console.log(i);})
Remove the breakpoint now before progressing with the exercise.
Add this to the Click Action of the table component:
function(){
  console.log(this);
}
And explore the this object, which is returned on the console.
In the Table Component set the Column Formats for the Member Full Path and Member Ordinal to hidden. This will remove the columns from the DOM, however, the data will still be available in the table component’s resultset.
Another important improvement is to use the CDE clickAction instead of the JQuery click event we currently use in the PostExecution function - in fact, this is the recommended/best practice approach.
function(e){
    var chosenPath = e.rawData.resultset[e.rowIdx][e.colIdx+1];
	console.log(chosenPath);
			var mdxFragment =
				"DRILLDOWNMEMBER(DESCENDANTS([Product], 1, SELF_AND_BEFORE),"
				+ chosenPath
				+ ")"
			;
			// update parameter value with chosen member
			dashboard.fireChange("param_line", mdxFragment);
}
As you can see using the CDE clickAction is a lot easier, as the required contextual information like row and column index are available straight away.
Make sure you delete the click function we previously set up for the postExecution function.
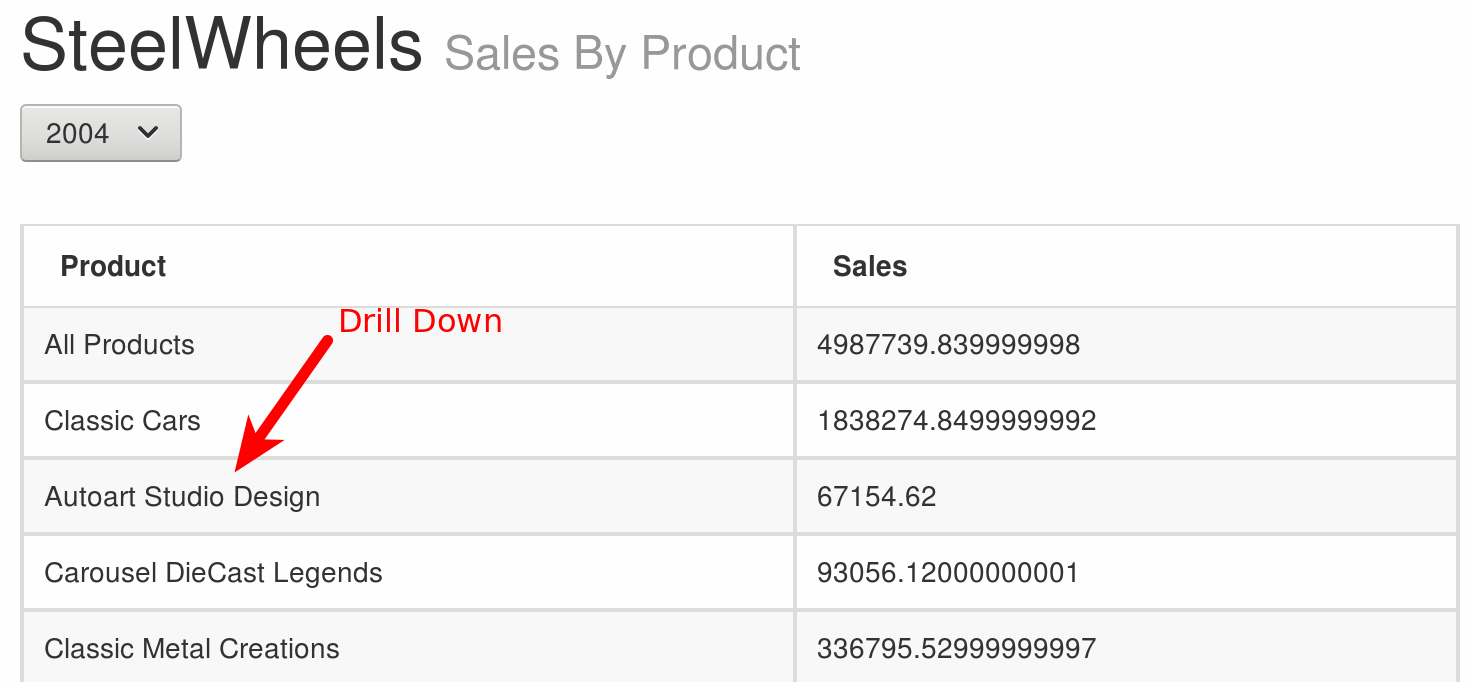
Preview the dashboard:
For now we can see that this approach is working. However, this still does not get rid of the MDX Injection problem. So instead of sending an MDX fragment as the parameter value, we should send something less sensitive, like just a simple value that cannot do any harm. Update the clickAction with the following code:
function(e){
	// pick up member name only - not whole path
	var chosenMember = e.rawData.resultset[e.rowIdx][e.colIdx];
	// pick up level ordinal
	var reportLevel = e.rawData.resultset[e.rowIdx][e.colIdx+2];
	// update parameter value with chosen member
	dashboard.setParameter("param_report_level", reportLevel);
	dashboard.fireChange("param_line", chosenMember);
}
Create a new simple parameter call param_report_level and leave its default value unset. Remove the default value for parameter param_line.
Adjust the table component to pick up this parameter as well.
Adjust the MDX query to this new version:
WITH
SET PRODUCT AS
	IIF(
		"${param_report_level}" = "" OR "${param_report_level}" = "0"
		, DESCENDANTS([Product], 1, SELF_AND_BEFORE)
		, DRILLDOWNMEMBER(
			DESCENDANTS([Product], 1, SELF_AND_BEFORE)
			, [Product].[Line].[${param_line}]
		)
	)
	MEMBER [Measures].[Member Full Path] AS
		[Product].CurrentMember.UniqueName
	MEMBER [Measures].[Member Ordinal] AS
		[Product].CurrentMember.Ordinal
SELECT
	NON EMPTY PRODUCT ON ROWS
	, {
		[Measures].[Member Full Path]
		, [Measures].[Member Ordinal]
		, [Measures].[Sales]
	} ON COLUMNS
FROM [SteelWheelsSales]
WHERE [Time].[Years].[${param_year}]
Make sure your MDX query has param_report_level defined as additional parameter.
Important considerations for setting default value for a custom parameter:
param_report_level = 0
Results in following error:
[info] WD: BuildQueryDefinition detected static parameter ...
The parameter will be used instead the parameter value
This Jira case suggests tackling this problem like so:
param_report_level = function(){
	return 0;
}
No, this doesn’t solve it either. Just don’t define any default value and check in the MDX query against an empty value (always treat as String).
While we got the first drill down working now, we will have to add an additional parameter to make the second drill down working: If we drill down to the second level, we also have to keep the context of the previously chosen first level member. We introduce a new simple parameter called param_vendor with no default value.
Next we adjust the clickAction for the table component:
function(e){
    console.log("======== CLICK ACTION =======");
    // pick up member name only - not whole path
	var chosenMember = e.rawData.resultset[e.rowIdx][e.colIdx];
    console.log("Chosen member: " + chosenMember);
	// pick up level ordinal
	var reportLevel = e.rawData.resultset[e.rowIdx][e.colIdx+2];
    console.log("Report level: " + reportLevel);
	// update parameter value with chosen member
	if (reportLevel < 2){
      dashboard.setParameter("param_line", chosenMember);
      console.log("Setting param_line to: " + chosenMember);
    } else {
      // do not overwrite
      // dashboard.setParameter("param_line", chosenMember);
      dashboard.setParameter("param_vendor", chosenMember);
      console.log("Setting param_vendor to: " + chosenMember);
    }
    dashboard.fireChange("param_report_level", reportLevel);
}
Adjust the MDX Query:
WITH
SET PRODUCT AS
  IIF(
    "${param_report_level}" = "" OR "${param_report_level}" = "0"
    , DESCENDANTS([Product], 1, SELF_AND_BEFORE)
    , IIF(
        "${param_report_level}" = "1"
        , DRILLDOWNMEMBER(
            DESCENDANTS([Product], 1, SELF_AND_BEFORE)
            , [Product].[Line].[${param_line}]
        )
        , DRILLDOWNMEMBER(
            DRILLDOWNMEMBER(
                DESCENDANTS([Product], 1, SELF_AND_BEFORE)
                , [Product].[Line].[${param_line}]
            )
            , [Product].[${param_line}].[${param_vendor}]
        )
    )
  )
  MEMBER [Measures].[Member Full Path] AS
    [Product].CurrentMember.UniqueName
  MEMBER [Measures].[Member Ordinal] AS
    [Product].CurrentMember.Ordinal
SELECT
  NON EMPTY PRODUCT ON ROWS
  , {
    [Measures].[Member Full Path]
    , [Measures].[Member Ordinal]
    , [Measures].[Sales]
  } ON COLUMNS
FROM [SteelWheelsSales]
WHERE [Time].[Years].[${param_year}]
Make sure you register the param_vendor parameter with the table component as well as with the MDX query.
Make the table component listen to param_report_level.
Making the data readable
We add some JavaScript to tag the rows with CSS properties according to MDX ordinal. Add to table component’s Draw Function the following:
function(){
    var myData = this.rawData.resultset;
  // check if resultset is not empty
  // otherwise we will get an error and no empty table will be displayed
  if(myData.length > 0){
    $("#" + this.htmlObject).find("tbody > tr").each(
      function(i, d){
        $(d).addClass("drill-down-level-" + myData[i][2]);
        $(d).find("td:first").addClass("drill-down-level-" + myData[i][2] + "-node");
      }
    )
  }
}
Note: Did you realise how we use the underlying dataset to extract the current level ordinal? True separation of content and display.
We will use a simple colour palette, just shades of grey (see here).
For the table component change the style to Classic.
Finally we add some very basic CSS properties to Layout > Add Resource. Choose Resource Type Css and Resource Source Code Snippet:
.numeric{
  text-align:right;
}

th{
  font-size:0.9em;
  padding-left:0.2em;
  background-color:gold;
  border-bottom: 1px solid white;
}

td{
  font-size:0.9em;
}

tbody > tr > td.column0:hover{
  background-color:lightblue;
}

.drill-down-level-0-node {
	padding-left: 0em;
}

.drill-down-level-1-node {
	padding-left: 0.4em;
}

.drill-down-level-2-node {
	padding-left: 2em;
}

.drill-down-level-3-node {
	padding-left: 3em;
}

.drill-down-level-0 {
	background-color:#E0E0E0;
}

.drill-down-level-1 {
	background-color:#E8E8E8;
}

.drill-down-level-2 {
	background-color:#F0F0F0;
}

.drill-down-level-3 {
  background-color:#F8F8F8;
}
You will realise that most of the formats do not get properly applied. Let’s analyse one example: .drill-down-level-1. You could just add !important at the end of the property definition, however, this is not a recommended approach. It is best to analyse which other property overwrites this one. Once you know this one, you can make our current property more specific than the other one, since more specific ones will overwrite the more generic ones. Right click on a row which should have the .drill-down-level-1 class assigned to it and choose Inspect Element. Make sure you select the <tr> element in the HTML panel and then in the style panel observe that table.dataTable > tbody > tr is overwriting .drill-down-level-1:
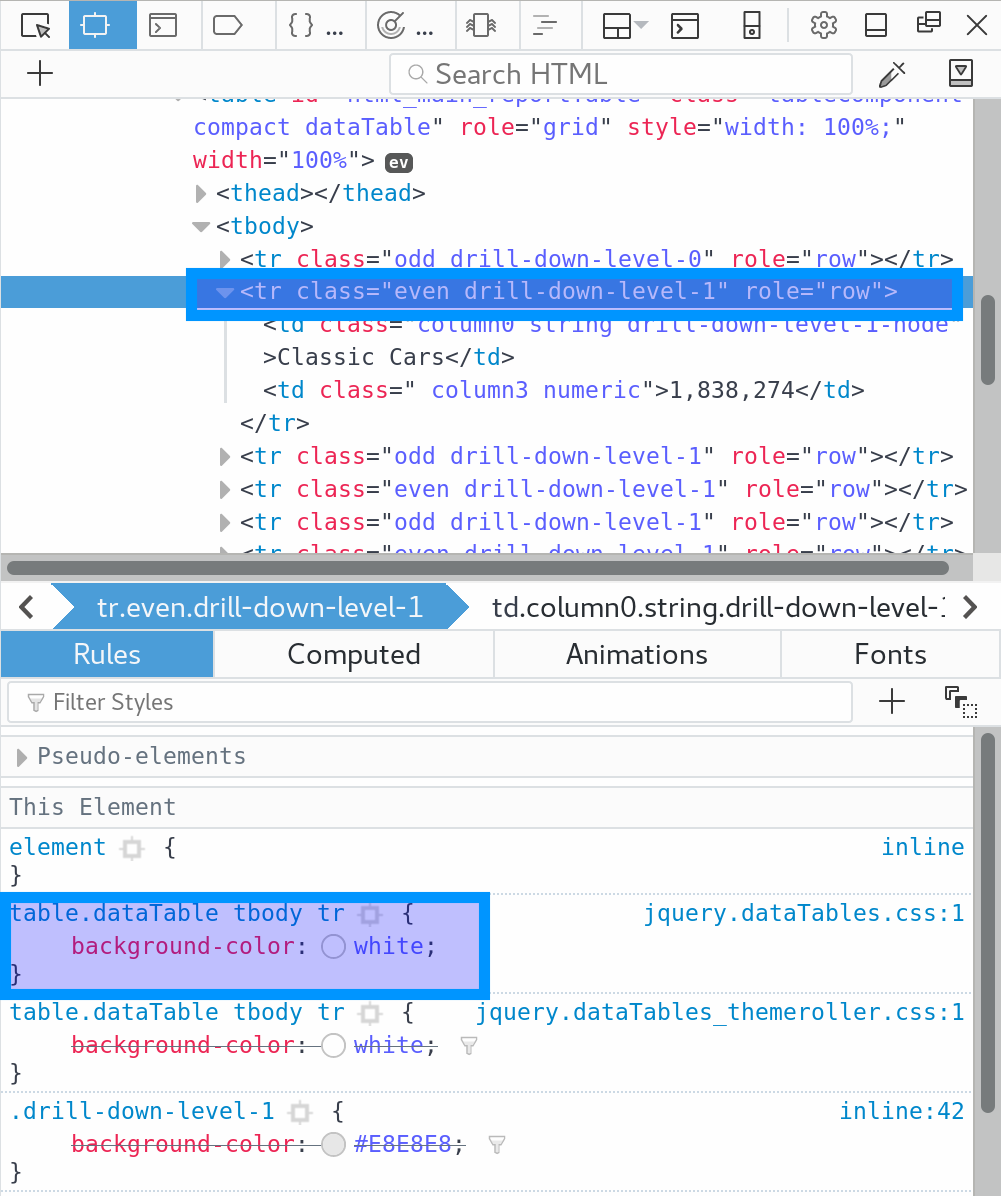
So now we know how to make our selector more specific:
table.dataTable > tbody > tr.drill-down-level-1
Adjust the CSS:
.numeric{
  text-align:right;
}

th{
  font-size:0.9em;
  padding-left:0.2em;
  background-color:gold;
  border-bottom: 1px solid white;
}

td{
  font-size:0.9em;
}

tbody > tr > td.column0:hover{
  background-color:lightblue;
}

table.dataTable > tbody > tr > td.drill-down-level-0-node {
	padding-left: 0.4em;
}

table.dataTable > tbody > tr > td.drill-down-level-1-node {
	padding-left: 1em;
}

table.dataTable > tbody > tr > td.drill-down-level-2-node {
	padding-left: 2em;
}

table.dataTable > tbody > tr > td.drill-down-level-3-node {
	padding-left: 3em;
}

table.dataTable > tbody > tr.drill-down-level-0 {
	background-color:#E0E0E0;
}

table.dataTable > tbody > tr.drill-down-level-1 {
	background-color:#E8E8E8;
}

table.dataTable > tbody > tr.drill-down-level-2 {
	background-color:#F0F0F0;
}

table.dataTable > tbody > tr.drill-down-level-3 {
  background-color:#F8F8F8;
}
And here our final result:
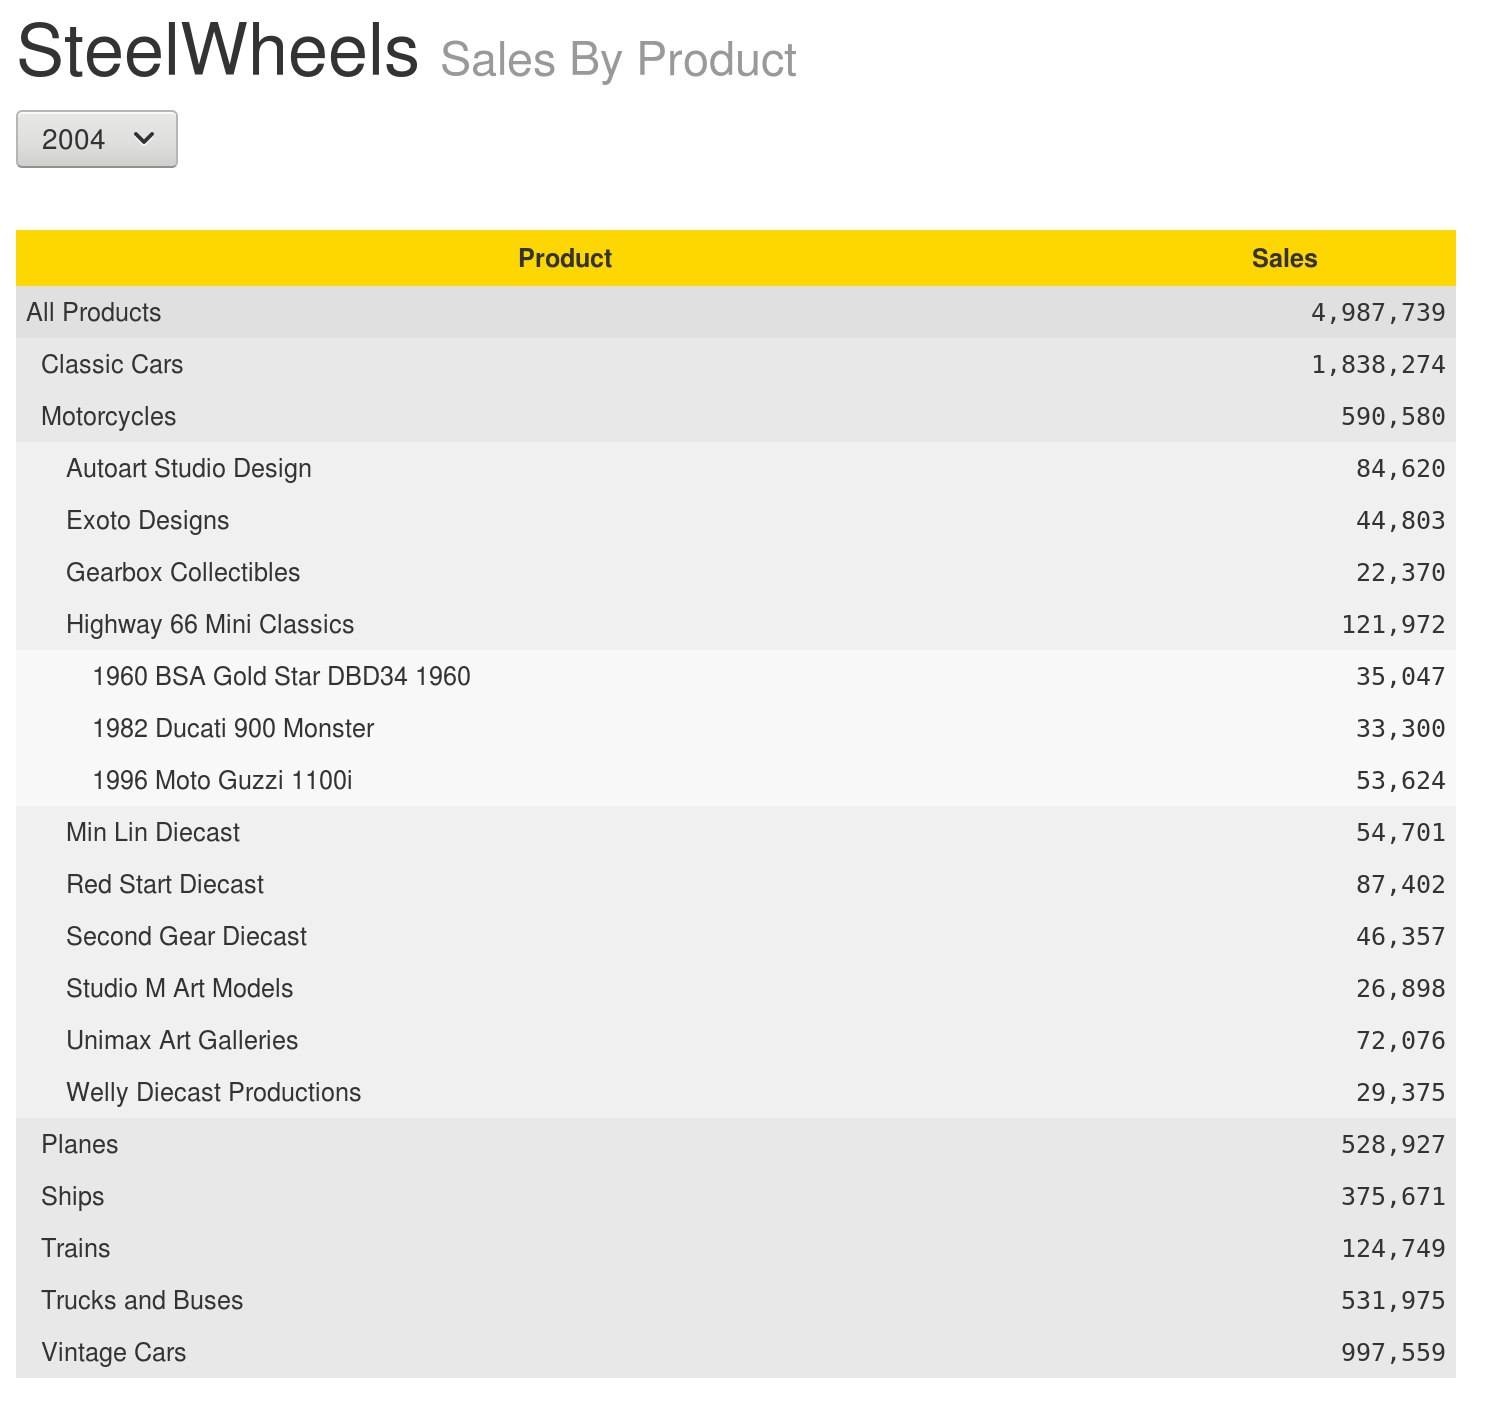
The Dashboard can be downloaded from here.
Finally, special thanks to Nelson Sousa for his insightful contribution.