It was a long time ago that I wrote my last article on Pentaho Report Designer (PRD). It’s an interesting tool, following the classic report layout strategies. PRD hasn’t received major updates in recent years (apart from crosstabs, which after many years of development finally made it out of beta last year). Classical operational reports are not required a lot these days any more, still, from time to time, I get some requests to create Excel or PDF reports for which PRD is the ideal tool.
PRD has a very nice integration with Pentaho Data Integration, meaning you can source data from pratically anywhere. PRD has also a wonderful support for dynamic formatting. One area where it falls dramatically short is charts: It’s still based on the old JFreeCharts and offers only a few configuration options via the GUI to customise the charts. You can use CCC charts with PRD, but this feels more like a hack than anything else.
Although PRD is not the most intuitive tool and requires quite a learning curve, once you are familiar with the tool, you start appreciating its handy features.
One feature I’ve been wanting to have a look at for a very long time was the table layout. There are many layout options in PRD, with the table layout being one of the latest additions (well latest means about four years old).
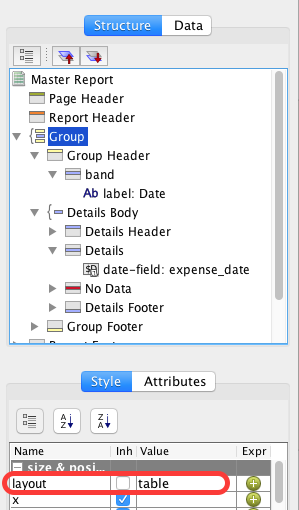
So how do you define a table layout in a PRD report? Remember that for most elements you can define the layout in the Style tab. To define a table, you have to set the following elements to the following layout type:
| Element | Layout type |
|---|---|
| Group | table |
| Group > Group Header | table-header |
| Group > Group Header > Band | table-row |
| Details Body | table-body |
| Details Body > Details | table-row |
In PRD this looks like this:
Once you export the report to HTML, you get a very nicely strucutred table (very simple example below):
  <body>
    <table cellspacing="0" cellpadding="0" class="style-0">
      <col style="width: 468pt" />
      <tr style="height: 20pt">
        <td valign="top" class="style-1">Date</td>
      </tr>
      <tr style="height: 20pt">
        <td valign="top" class="style-1">2015-08-01</td>
      </tr>
      <tr style="height: 20pt">
        <td valign="top" class="style-1">2015-08-02</td>
      </tr>
      <tr style="height: 20pt">
        <td valign="top" class="style-1">2015-08-03</td>
      </tr>
    </table>
  </body>
At the end of this article I’d like to thank Thomas Morgner for taking the time to discuss the table layout with me. A pro tip by Thomas:
“Normal content is automatically wrapped into a table-cell box if there is none there yet. That means each label/field/etc ends up in its own cell. (Same behaviour as in HTML if you have a malformed table).
If you want to combine multiple elements into one cell or want to set col-span and row-span, then you’d use a band with layout as table-cell to do so.”