Sometimes you will have to manipulate the presentation of a cell value within the CDE Table Component. Probably the easiest way to do this is to write an AddIn. This gives you access to the cell value as well as to the whole resultset (and the column and row number as well).
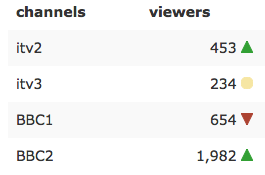
We will create a very simple AddIn, which will actually use two values: one figure for standard display and another one to conditionally display a trend arrow:
Let’s quickly create the AddIn: Add the below to your JavaScript snippet or external file:
var figureAndTrendArrow = {
	name: "figureAndTrendArrow",
	label: "Figure and Trend Arrow",
	defaults: {
		numberFormat: '#,###',
		trendFigureColIndex: null,
		flipped: false, // flips the arrows
	},

	implementation: function (tgt, obj, opt) {
		// get td element
		var t = $(tgt);
		var row = obj.rowIdx;
		var data = obj.rawData.resultset;
		// col no for trend figure
		var col = '';

		/* didn't include code to make col sortable - see doc for details */

		// by default use col next to figure col for trend
		if( opt.trendFigureColIndex === null){
				col = obj.colIdx + 1;
		} else {
				col = opt.trendFigureColIndex;
		}


		var trendArrowUp = '<svg height="12" width="12"><polygon points="0,12 6,0 12,12" style="fill:#2CA12D;stroke:#2CA12D;stroke-width:1" /></svg>';
		var trendArrowDown = '<svg height="12" width="12"><polygon points="0,0 6,12 12,0" style="fill:#AF432E;stroke:#AF432E;stroke-width:1" /></svg>';
		var trendArrowNeutral ='<svg height="12" width="12"><circle cx="6" cy="6" r="6" stroke="#F7E7A0" stroke-width="1" fill="#F7E7A0" /></svg>';

		if(data[row][col] > 0){
			trendArrow = opt.flipped ? trendArrowDown : trendArrowUp;
		} else if(data[row][col] < 0){
			trendArrow = opt.flipped ? trendArrowUp : trendArrowDown;
		} else {
			trendArrow = trendArrowNeutral;
		}

		t.html('<span style="float: right">' + Dashboards.numberFormat(obj.value, opt.numberFormat) + ' ' + trendArrow + '</span>');

	}
};

Dashboards.registerAddIn("Table", "colType", new AddIn(figureAndTrendArrow));
It is quite easy to understand what is going on: First we create the AddIn definition: We specify the name (this is the name we will reference later on in the Table Components Column Type), a label and a few defaults. The defaults set the formatting string for the main figure and enforces using the green up arrow as a positive trend indicator (flipped: false).
The whole cell td element is available as a jQuery object, which we can manipulate to our liking. The plain data point value is available as value. The only challenge we are facing is to source the value of the trend figure, but this one we can directly retrieve from the resultset array using the rowIdx and colIdx. We assume that the figure for the trend is in the column directly following the one which holds the main figure.
Then we just add a conditional statement to figure out which trend arrow should be displayed (we use plain SVG here for the icons).
And finally we add the figure and the trend arrow to the cell using the jQuery html() method. We could also add code to hide the column with trend figure by default, but this might confuse the end user, so we just ask the end user to set the Column Type of this trend figure column to hidden.
All that is left to do is to register the AddIn with the Dashboards namespace.
The very good point is that this code is now completely reusable! Any table and any column can make use of this code by setting the Column Type to figureAndTrendArrow. If you want to override the defaults, you can do this in the PreExecution function. You can configure the formatting string of the main figure as well as let the AddIn know where the trend figure is located (in case it is not directly after the main figure).
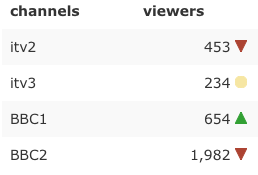
Let’s assume we don’t want to accept all defaults, but instead flip the direction of the arrows: We can add this to the Table Component’s PreExection function:
function(){

    // Option 1 :Static list

    this.setAddInOptions("colType","figureAndTrendArrow",{flipped: true});

}
There might be a problem, however, if we applied the format to more than one column and only want one of these columns to behave differently. In this case we have to take the column index into account. Also, with this new option, it is possible to make everything more dynamic as well:
function(){

    // option 2: function
    this.setAddInOptions("colType","figureAndTrendArrow",function(state){
        // Only apply to 2nd column
        if(state.colIdx == "1"){
            return { flipped: true};
        }
    });
}
Also note that the object passed to the function (named state in this case) contains a lot of other info that you might want to use to dynamically define properties for the AddIn.
As you can see, creating AddIns in Pentaho CDE is quite easy and it helps you to keep the logic in one place!