This is a seemingly trivial example of changing a chart’s value labels - it turns out, there are many ways to achieve this goal with CCC!
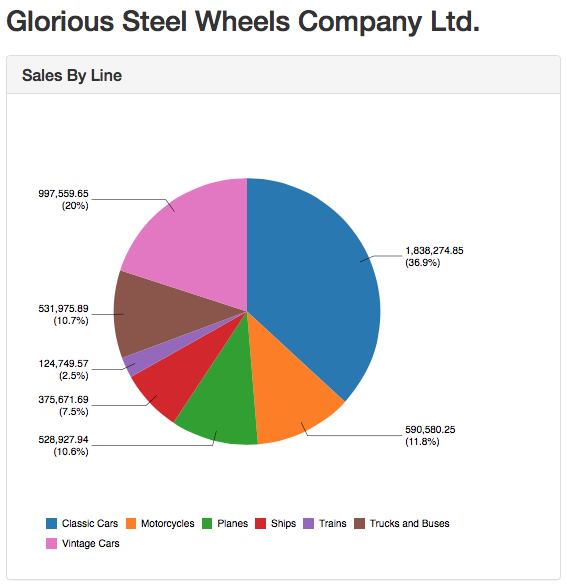
Our initial pie chart looks like this:
First we can define the type of values to be displayed, which can be either the value or percentage or a combination of both. This can be specified using the valuesMask property:
// various possibilities
valuesMask: '{value.percent}'
valuesMask: '{value}'
valuesMask: '{value} ({value.percent})'
// the same, but more explicit
valuesMask: '{value.label} ({value.percent.label})'
valuesMask: '{category}: {value} EUR'
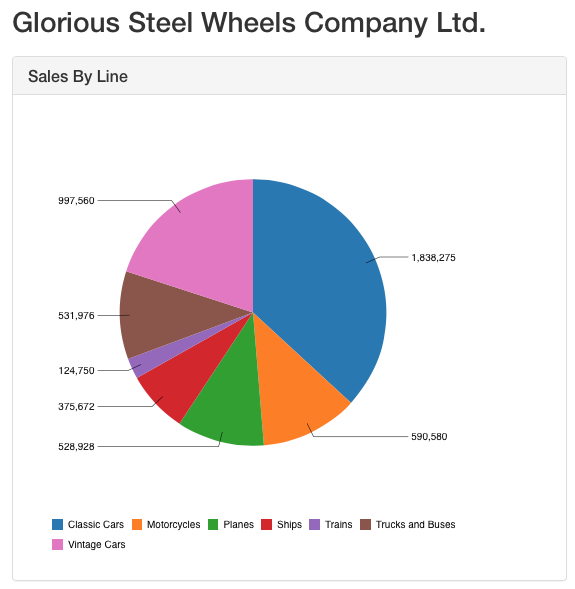
One of the easier ways to manipulate the value labels is to use the Extension Point label_text, e.g.:
label_text: function(obj) {
    return Dashboards.numberFormat(obj.vars.value.value, '#,###');
}
WARNING: If you did not define the valuesMask at all or you use both value and percent in the valuesMask (e.g.
{value} ({value.percent})) you will see two labels with the same text (thevalue) for each slice of the pie when you apply the above script for thelabel_textextension point. Hence make sure you set thevaluesMaskto{value}! If you want to format both value and percentage it is better to use the other approaches listed further down this article.
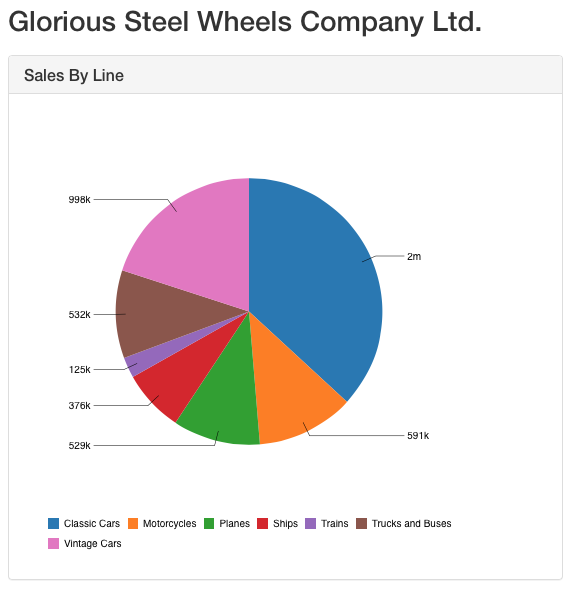
Or let’s say we want to value to take up less space and display it as thousands, millions etc:
function(obj) {
    return Dashboards.numberFormat(obj.vars.value.value, '#A');
}
However, there are many other ways to define a format:
You can use the valuesFormat and percentValueFormat properties:
valueFormat: function(v) {
    return Dashboards.numberFormat(v, '#,###');
},
percentValueFormat: function(v) {
    return Dashboards.numberFormat(v, '#.00%');
}
Another approach is to use the format property, which is not available in CDE. We can, however, just manually add it using the PreExecution function:
function(){
    this.chartDefinition.format = {
        number:  "#,#.0000",
        percent: "#.0000%"
    };
}
The most complex way is to use the dimensions to define the formatter. Again, we can do this via the PreExecution function:
function(){
    this.chartDefinition.readers = [ { names: 'line, sales' } ];
    //the below works also:
    //this.chartDefinition.readers = ['line, sales'];
    this.chartDefinition.dimensions = {
       line: {label: 'Line'},
       sales: {
            valueType: Number,
            label: 'Sales',
            format: {
                number:  "#,#.0000",
                percent: "#.0000%"  // BUG <-- not being used by the pie chart for value.percent labels
            }
        }
   };
   this.chartDefinition.visualRoles = {
       category: 'line',
       value: 'sales'
   };
}
If you still insist on specifying both the value and percentage format via the extension point, you could do something like this:
 format: {number: '#,###.00', percent: "%#.00"},
    valuesVisible: true,
    valuesLabelStyle: 'inside', // optional
    label_text: function(scene) {
        // Use the chart's number format
        var numberFormat  = this.chart.format().number();
        var percentFormat = this.chart.format().percent();
        var valueVar = scene.vars.value;
        return numberFormat (valueVar.value) + " / " +
               percentFormat(valueVar.percent.value);
    }
So what’s the difference between all these approaches you might ask? Duarte Cunha Leão explains:
Within CCC, formatting information can be specified at several levels:
- Global:
cdo.format.defaults - Chart:
chartDefinition.format = ... - Dimension:
dimensions.["foo"].format = ...
The most specific format info wins. Partial info configured at one level does not hide the unspecified info, which is still inherited. This applies to both masks and styles. So, if you specify format.number.mask at the chart level, you’ll still inherit the format.number.style or the percent.mask, etc.
See FormatProvider at the CCC options docs for more on this.
Then, there’s the “legacy” and CDE property availability factor. At the chart level:
- specifying
valueFormatis equivalent to specifying:format: {number: ...}. - specifying
percentValueFormatis equivalent to specifying:format: {percent: ...}.
These definitions will be used by any numeric dimension that does not have a format.number or format.percent specified.
At the dimension level, there’s also another variant which is the dimension’s formatter option. This one accepts a function directly and also came to existence before the generic “format” thing.
Then, you have extension points…
The formatting info above is used to format the values of atoms in the data and of variables of scenes. Later these labels are shown in the tooltip, the legend, and in discrete axes and are thus shared by all these consumers.
On the other hand, extension points are for the most part mark/sign specific. So, a text extension point allows you to change the text of a specific mark and even instance of that mark. Also, as a general rule, anything you configure in an extension point, by using a function (a dynamic extension point) is not taken into account in the chart or chart component layout.
You can read about the generic signature of extension points here.
A cut through a scene object:
scene -> {
vars: {
"category": { // category variable
value: "PT",
label: "Portugal"
}
}
}
All stacked-like or hierarchical charts (Bar, Waterfall, Pie, Sunburst, Treemap, …?) have a nested “percent” variable in their “value” or “size” variable (depends on the chart):
vars: {
"value" : {
value: 12,
label: "12.0",
percent: {
value: 0.5,
label: "50%"
}
}
}
Below you can find Duarte’s JSFiddle) example, which he kindly provided to me. This list all the options:
new pvc.PieChart({
    canvas: "cccExample",
    width:  600,
    height: 400,

    // Data source
    crosstabMode: false,
    readers: ["line, sales"],

    // Visual Roles
    categoryRole: "line",
    valueRole:    "sales",

    format: {
      // number:  "#,#.0000", // This works!
      // percent: "#.0000%"   // This works!
    },

    // This works!
    // valueFormat: function(v) { return v.toFixed(3) + "!!"; }, // This works!

    // This works!
    // percentValueFormat: function(v) { return (100*v).toFixed(2) + "%%"; },

    // Main Plot
    valuesVisible: true,
    dimensions: {
        sales: {
            format: {
                number:  "#,#.0000",
                percent: "#.0000%"  // BUG <-- not being used by the pie chart for value.percent labels
            },
            valueType: Number
        }
    },

    // Chart/Interaction
    animate:    false,
    selectable: true,
    hoverable:  true
})
.setData(relational_03_b)
.render();