This is the second article in the D3 series. Previously, in the D3 Map: Getting Started, we started working on our GB map and tried to apply colour coding. In this article we will feed in the UK General Election Results 2015 data dynamically by using the CDA data services provided by the open source version of the Pentaho BA Server.
All files related to this project can be downloaded from here.
Integrating D3 Maps With Pentaho CDE Dashboards
The Pentaho BA Server offers some fantastic features to create and publish dashboards using C-Tools. As C-Tools dashboards are based on standard HTML5 technologies, it is fairly straight forward in most cases to add new technologies like D3.
In general, we have to consider a few points: We know that our map file is fairly big in comparison to the data/features. When presenting the map in the web browser, it would be best to only load the map once (and hence not reload it completely with any change of the displayed feature data). We will assume that our data is not static, which means we cannot just combine the data with the TopoJSON file. Combining the data with the TopoJSON is also not a good idea if we want to grant restricted access to the data for a specific audience. Data access features are already implemented as part of the Pentaho BA Server and we do not want to reinvent the wheel here.
So our strategy is as follows:
- Use standard Pentaho data sources (in this case CDA (Community Data Access) to load all the feature data (e.g. election data)
- Load the map from the TopoJSON file once. Currently CDA does not seem to support any GIS databases.
- Join the map and feature data using JavaScript code.
First let’s create a dedicated schema on our PostgreSQL database with the required tables:
CREATE DATABASE elections;

\c elections

CREATE SCHEMA stg_d3_map;

CREATE TABLE stg_d3_map.uk_voting_results
(
    firstname VARCHAR(255)
    , lastname VARCHAR(255)
    , party_name VARCHAR(255)
    , constituency_name VARCHAR(255)
    , press_association_number INTEGER
    , ons_gss_code VARCHAR(20)
    , count_votes INTEGER
    , share_votes NUMERIC
)
;

CREATE INDEX uvr_press_association_number
ON stg_d3_map.uk_voting_results(press_association_number)
;

CREATE TABLE stg_d3_map.uk_voting_constituencies
(
    press_association_number INTEGER
  , constituency_name VARCHAR(255)
  , ons_gss_code VARCHAR(20)
  , constituency_type VARCHAR(20)
  , count_eligible_electors INTEGER
  , count_valid_votes INTEGER
)
;

CREATE UNIQUE INDEX uvc_press_association_number
ON stg_d3_map.uk_voting_constituencies(press_association_number)
;


CREATE VIEW stg_d3_map.vw_uk_voting_winners
AS
SELECT
    constituency_name
    , a.ons_gss_code
    , party_name
    , a.count_votes
    , a.share_votes
FROM stg_d3_map.uk_voting_results a
INNER JOIN
(
    SELECT
        press_association_number
        , MAX(count_votes) AS count_votes
    FROM stg_d3_map.uk_voting_results
    WHERE
        press_association_number IS NOT NULL
    GROUP BY 1
) b
ON
    a.press_association_number = b.press_association_number
    AND a.count_votes = b.count_votes
;
If you do not have PostgreSQL installed but another database, it should be fairly easy to create a similar schema there as well.
Let’s import the data using the PDI transformation tr_import_election_data.ktr which you can download from here inside the etl folder. Make sure you download the whole project folder, so that the election results data is included as well. Run this transformation from Spoon (the PDI GUI client) or from the command line with pan.sh.
Finally check with your favourite SQL if the data was imported:
SELECT * FROM stg_d3_map.uk_voting_winners LIMIT 20;
We have to join the map details and the election results based on the pcon13cd and ons_gss_code fields (which hold both the same data):
topojson \
      --id-property PCON13CD \
      --properties name=PCON13NM \
      -o constituencies-cde.topo.json \
      constituencies.json
We will later on upload the TopoJSON file to the Pentaho BA Server.
For the next few steps I will only provide a brief description. If you need an introduction to Pentaho C-Tools (C for Community), you will be able to find enough resources on the internet.
Log on to the Pentaho BA Server and make sure you have a connection defined to the database we just created. Create a new dashboard using CDE.
In the Data Source panel define a new SQL Query (SQL over JNDI), name it qry_parties and define following query:
SELECT DISTINCT party_name FROM stg_d3_map.uk_voting_results;
Create another query called qry_party_share and specify following query:
SELECT
    ons_gss_code
    , share_votes AS count_votes
FROM stg_d3_map.uk_voting_results
WHERE
    party_name = ${param_party}
;
As parameter define param_party.
Save the dashboard in the dedicated folder. When you go to the Browse Files perspective you should now see a CDA (Community Data Access) file. Double click on it. Once it is opened, choose the defined query from the pull down menu and you should see the result of the query displayed (don’t forget to provide a parameter value).
Now we do know that the queries are working properly. Go back to CDE.
In the Layout panel:
- Add a row and a column. Name the column
html_select_party. - Add another row and a column. Name the column
html_map. -
Add an internal CSS resource and add following styles:
path { fill: #e5e5e5; stroke: #fff; stroke-width: 0.5px; } .q0-9 { fill:rgb(247,251,255); } .q1-9 { fill:rgb(222,235,247); } .q2-9 { fill:rgb(198,219,239); } .q3-9 { fill:rgb(158,202,225); } .q4-9 { fill:rgb(107,174,214); } .q5-9 { fill:rgb(66,146,198); } .q6-9 { fill:rgb(33,113,181); } .q7-9 { fill:rgb(8,81,156); } .q8-9 { fill:rgb(8,48,107); } -
Download the JavaScript dependencies, e.g. on the command line:
cd ~/Downloads wget https://cdnjs.cloudflare.com/ajax/libs/d3/3.5.5/d3.min.js wget https://cdnjs.cloudflare.com/ajax/libs/topojson/1.6.19/topojson.min.js -
In the Pentaho User Console (in simple words the website of your Petaho BA Server) upload these files into the directory where the dashboard is saved in (using the Browse Files perspective). Also upload the
constituencies-cde.topo.jsonfile (the TopoJSON map file).Note: It might be that you get an error message when uploading the JSON map file. In this case, open
pentaho-solutions/system/ImportHandlerMimeTypeDefinitions.xmlin a good text editor and add the following inside the<MimeTypeDefinitions>element:<MimeTypeDefinition mimeType="application/json" hidden="false"> <extension>json</extension> </MimeTypeDefinition>Restart the BA Server for the changes to take effect.
- Go back to the Opened perspective to see your dashboard. Back in the Layout panel, specify the two JavaScript files as external JavaScript resources.
In the Components panel add a Simple Parameter from the General section. Name the parameter param_party.
- Name:
param_party
Add a SelectComponent from the Select section.
- Name:
comp_select_party - Parameter:
param_party - Datasource:
qry_parties - HTMLObject:
html_select_party
In the Components panel add a Query Component from the Others section. Set the following properties:
- Name:
comp_map - Listener:
param_party - Parameter:
param_party - HtmlObject:
html_map - Datasource:
qry_party_share - ResultVar:
election_results - Add this to the PostExecution function:
function(){
    var election_results_d3 = [];

    for(var i=0; i < election_results.length; i++){
        var dataObject = {};
        dataObject.ons_gss_code = election_results[i][0];
        dataObject.count_votes = election_results[i][1];
        election_results_d3.push(dataObject);
    }

    // CREATE MAP

    // only create map if it does not exist already

    if( $('#election-map').length === 0 ){

        //var width = 700,
          //  height = 1000;

        var width = 500,
            height = 800;

        var projection = d3.geo.albers()
            //.center([0, 55.4])
            .center([3, 54])
            .rotate([4.4, 0])
            .parallels([50, 60])
            .scale(4000)
            .translate([width / 2, height / 2])
            //.translate(200,200)
            ;

        var path = d3.geo.path()
            .projection(projection);

        //var svg = d3.select('body').append('svg')
        var svg = d3.select('#html_map').append('svg')
            .attr('width', width)
            .attr('height', height)
            .attr('id', 'election-map')
        ;

        d3.json('constituencies-cde.topo.json', function(error, topology) {
            // create a polygon for every constituency
            svg.selectAll('.constituency')
                // retrieve the features so that we can access the id
                .data(topojson.feature(topology, topology.objects.constituencies).features)
                .enter().append('path')
                //.attr('class', function(d) { return 'constituency ' + d.id; })
                .attr('id', function(d) { return d.id; })
                .attr('d', path)
                ;

        });
    }

    // ADD COLOR CODES

    var quantize = d3.scale.quantize()
    .domain([
        d3.min(election_results_d3, function(d) { return d.count_votes; })
        , d3.max(election_results_d3, function(d) { return d.count_votes; })
        ])
    .range(d3.range(9).map(function(i) { return "q" + i + "-9"; }))
    // Note 9 define in the range() function relates to the 9 CSS styles we defined above
    ;

    // remove any previous color codes
    // as we might not have data for all constituencies
    // the new styles would only overwrite the color code of some constituences
    // but not others
    $('path').removeAttr('class');


    // assign new color codes
    election_results_d3.forEach(function(elt, i) {
        $('#' + elt.ons_gss_code).attr('class', quantize(elt.count_votes));
    });
}
A few notes on the code changes:
- We nest the map within the
#html_mapelement now (d3.select('#html_map').append('svg')). - Our code checks if the map is already loaded or not - this avoids reloading the map when the user changes the data selection. We add the id
election-map(.attr('id', 'election-map')) to the SVG element to make this happen. - Each time the user changes the data selection, all the color codes get removed and only then the new color codes get applied. We cannot just replace the existing color codes, because it might be that a specific political party is not present for one of the constituencies.
Note: To preview the dashboard you can just click on the Preview icon within CDE. However, previewing the dashboard this way didn’t show the map in my case. I had to go to the Browse Files perspective and chose the option Open in new window.
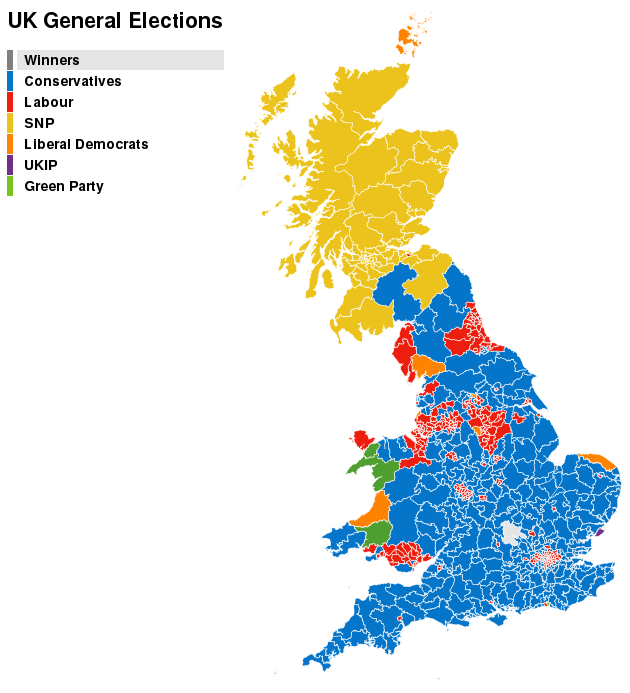
If you spend a little bit more time on the creating the dashboard, you can show the winners by constituency and also the share for each party by constituency.
The winners by constituency:
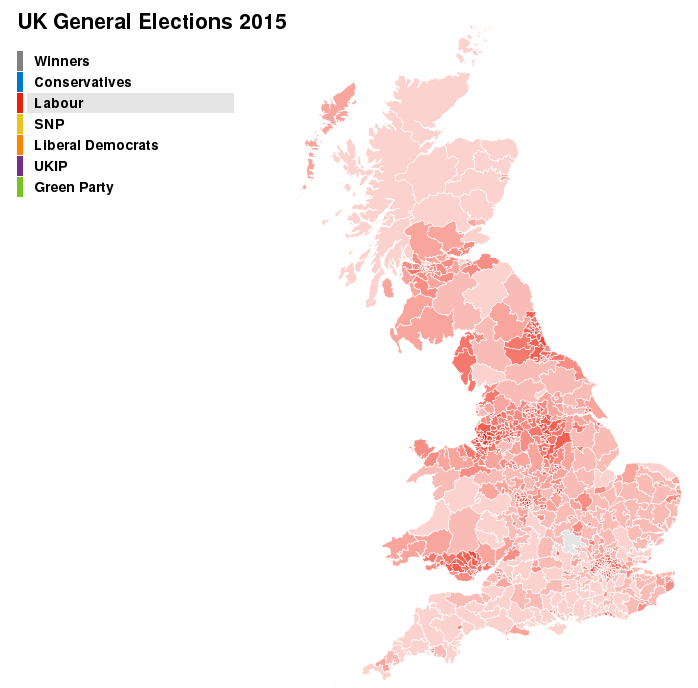
The share for a selected party by constituency: In this case the Labour party is selected. Note that the color of the party is used for the color shades in the map:
There is still quite a lot that can be done to improve the map. Currently it is very static, so adding e.g. a zoom function and popup info (to show further info) for each constituency would be the next steps to do.