Welcome to the third part of my series focused on D3JS. While Part 1 explained the fundamentals, Part 2 focused on integrating the D3 Map with dynamic data feeds from the Pentaho BA Server. In Part 3 we will focus on D3 again: I prepared a standalone HTML version of the final map shown in the Part 2 article (focusing only on displaying the election winners). To this map we will add Tooltips and a Zoom function.
The Basics
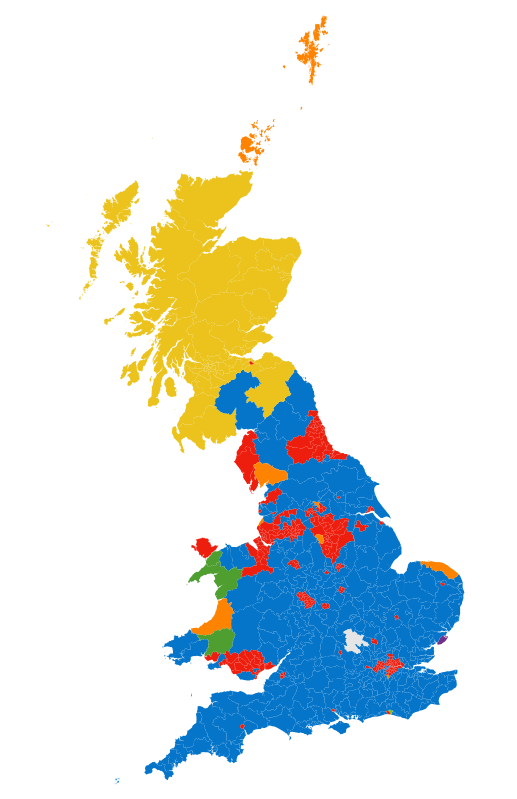
As mentioned early, I prepared a new example, which shows the winning party by constituency. I would like to discuss first how this was implemented:
This time there are two data files to load:
- the map file
- the election data file
To make sure that all these data is loaded before generating the map, we make use of the queue.js asynchronous helper library.
Once the files are loaded, the ready function is called. The code block within the ready function is fairly similar to the code we generated in the first article, although some adjustments have been made. One of them is that we join the datasets using a forEach loop with a nested filter function.
Adding Country Boundaries
This section comes with no code sample.
Another nice thing to have on our map would be the country borders. In this case there is also no need to create individual geometries for each country - we just want to show all the borders.
Let’s add a new style for the country borders:
.country-borders{
    fill: none;
    stroke: #fff;
    stroke-width: 0.25px;
    stroke-linejoin: round;
    stroke-linecap: round;
    pointer-events: none;
}
We nest our constituency polygons in an svg group and add an extra svg group for the country borders. TopoJSON features the mesh function, which will create a multiline geometry representing the borders. We will also apply the filter function to not draw any borders along the coastline (in other words, if a country does not border another country, we will not draw a border):
// draw borders seperately to not get any overlapping borders
var countriesBorders = topojson.mesh(topology, topology.objects.countries, function(a, b) { return a !== b; });

g.append("path")
    .datum(countriesBorders)
    .attr("class", "country-borders")
    .attr("d", path);
Adding a Tooltip
First we add a div to the map:
var tooltip = d3.select('#map').append('div')
    .attr('class', 'tooltip')
;
Within the ready function we then adjust the paths for the constituencies: We add on mousemove and mouse out events to show and hide the tooltip respectively.
// create a polygon for every constituency
svg.selectAll('.constituency')
.data(constituencies)
.enter()
.insert('path')
// assign id from feature data
.attr('id', function(d) { return d.id; })
//.attr('class', 'constituency')
.attr('d', path)
.attr('class', function(d){
    return (d.partyName).toLocaleLowerCase().replace(' ','-')
        + ' constituency';
})
// tooltip
.on('mousemove', function(d,i){
    var mouse = d3.mouse(svg.node()).map(
        function (d) {
            return parseInt(d);
        }
    )
    ;

    tooltip
        .classed('hidden', false)
        .attr('style', 'left:' + (mouse[0]+25) + 'px; top:' + mouse[1] + 'px')
        // tooltip text:
        .html(
            '<b>' + d.constituencyName + '</b></br>'
            + d.partyName + '</br>'
            + d.shareVotes + '%'
        )

})
.on('mouseout', function(d,i){
    tooltip.classed('hidden', true)
})
;
Finally we also add the required CSS styles:
.hidden {
    display: none;
}

div.tooltip {
    color: #222;
    background: #fff;
    padding: .5em;
    text-shadow: #f5f5f5 0 1px 0;
    border-radius: 2px;
    box-shadow: 0px 0px 2px 0px #a6a6a6;
    opacity: 0.9;
    position: absolute;
}
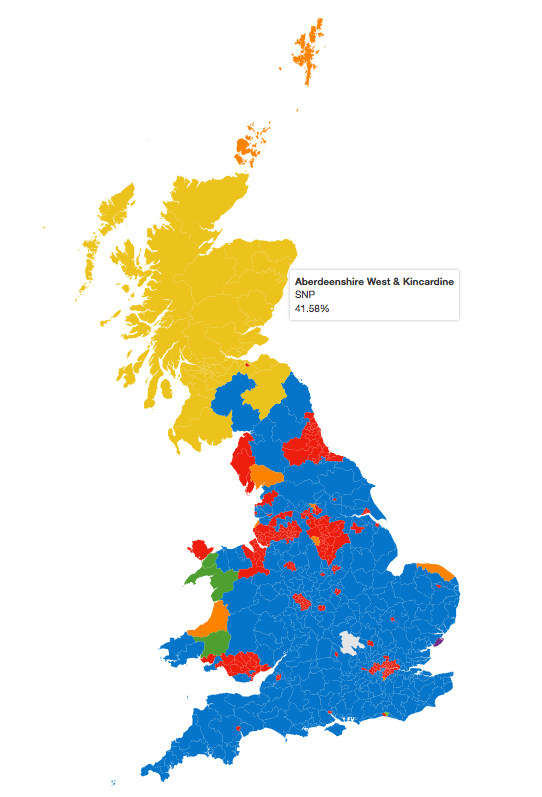
With a few lens of code we just created a very nice tooltip - who imagined it was that easy?!
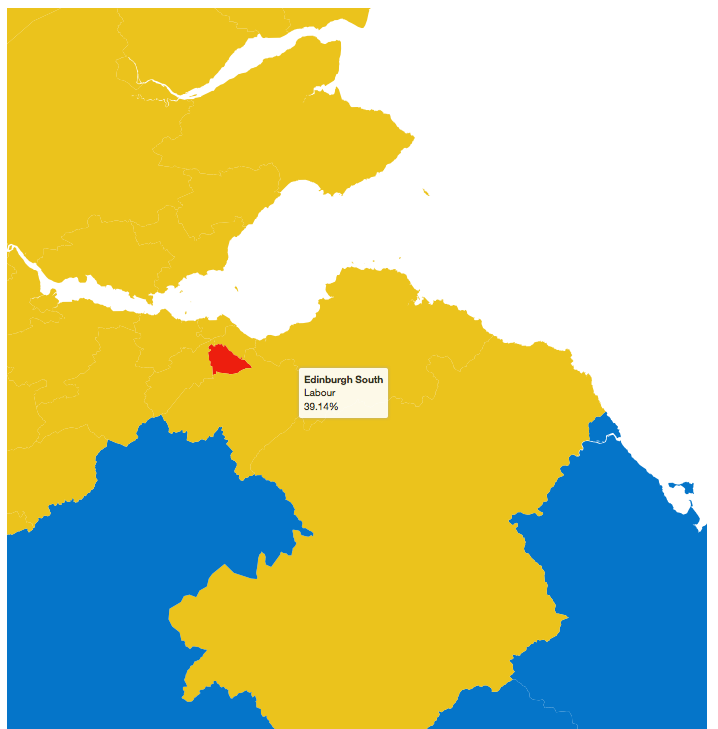
Adding a Zoom Function
Basic Zoom
Here we will simply make use of the D3 Zoom Behavior feature.
The first approach will be very simple and supports zooming via double tapping on the trackpad or vertical double finger swipe technique:
var svg = d3.select('#map').append('svg')
    .attr('width', width)
    .attr('height', height)
    // for zoom
    .call(d3.behavior.zoom().on('zoom', redraw))
    ;

function redraw() {
    svg.attr('transform', 'translate(' + d3.event.translate + ') scale(' + d3.event.scale + ')');
}
An alternative approach is shown here: Map Pan & Zoom II
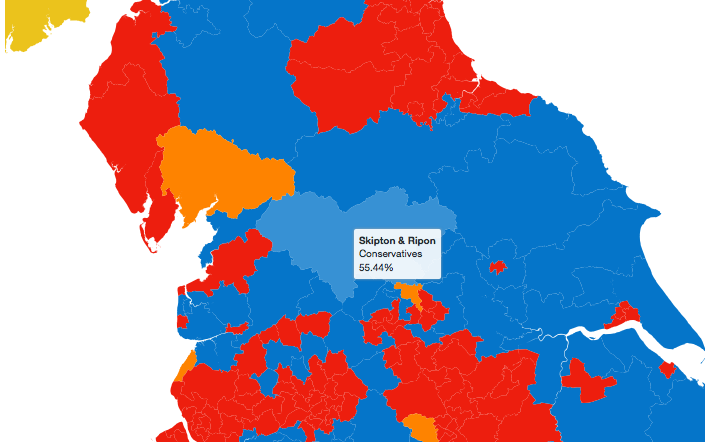
Click on Constituency Triggers Zoom (Click to Zoom)
Use case: On page load the whole map is displayed. When the end user single clicks on a particular constituency, the specific area should be enlarged.
I slightly changed the main code and added the following (most important points only):
-
Create a CSS style to highlight the selected constituency. We simply change the opacity of the background color to 80%.
.active { fill-opacity: 0.8; } - Defined a global variable called
centeredwith no value. -
Created a global
clickedfunction.function clicked(d) { var x, y, k; if (d && centered !== d) { var centroid = path.centroid(d); x = centroid[0]; y = centroid[1]; k = 4; centered = d; } else { x = width / 2; y = height / 2; k = 1; centered = null; } g.selectAll("path") .classed("active", centered && function(d) { return d === centered; }); g.transition() .duration(750) .attr("transform", "translate(" + width / 2 + "," + height / 2 + ")scale(" + k + ")translate(" + -x + "," + -y + ")") .style("stroke-width", 1.5 / k + "px"); } -
Added a
clickevent to thesvgelement as well as to allpathelements..on('click', clicked);
All changes are based on this example.
Click on External Link Triggers Zoom
Use case: Via a drop down list the end user can pick one constituency and the map is supposed to zoom in on this constituency. You can find a good example here
Sources: